Immigrants from Ireland vs Creek Male Poverty
COMPARE
Immigrants from Ireland
Creek
Male Poverty
Male Poverty Comparison
Immigrants from Ireland
Creek
9.1%
MALE POVERTY
99.9/ 100
METRIC RATING
7th/ 347
METRIC RANK
14.1%
MALE POVERTY
0.0/ 100
METRIC RATING
306th/ 347
METRIC RANK
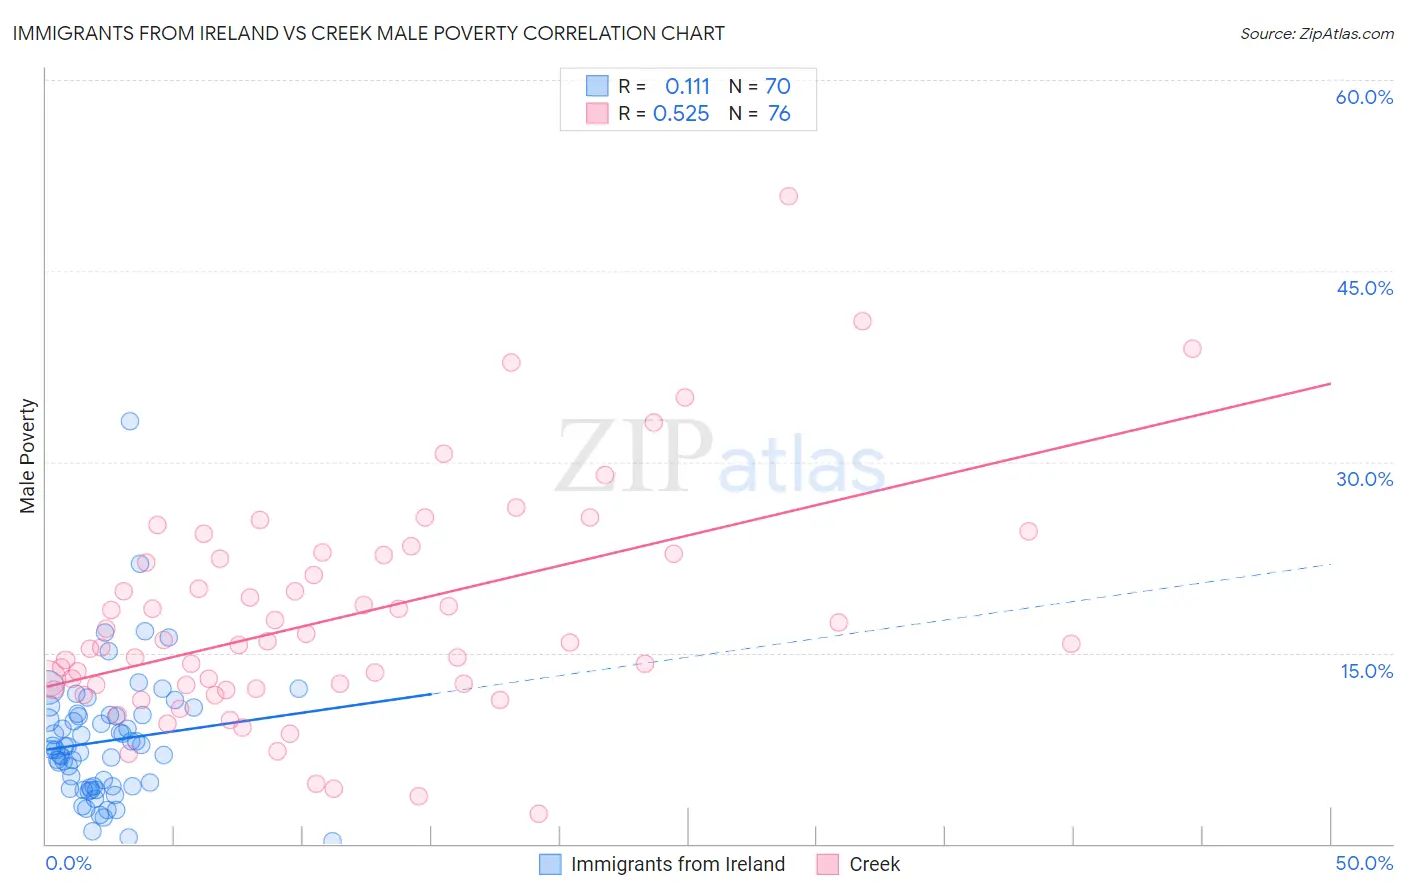
Immigrants from Ireland vs Creek Male Poverty Correlation Chart
The statistical analysis conducted on geographies consisting of 240,683,181 people shows a poor positive correlation between the proportion of Immigrants from Ireland and poverty level among males in the United States with a correlation coefficient (R) of 0.111 and weighted average of 9.1%. Similarly, the statistical analysis conducted on geographies consisting of 178,404,623 people shows a substantial positive correlation between the proportion of Creek and poverty level among males in the United States with a correlation coefficient (R) of 0.525 and weighted average of 14.1%, a difference of 54.4%.
Male Poverty Correlation Summary
| Measurement | Immigrants from Ireland | Creek |
| Minimum | 0.22% | 2.3% |
| Maximum | 33.2% | 50.8% |
| Range | 33.0% | 48.5% |
| Mean | 8.1% | 17.8% |
| Median | 7.5% | 15.7% |
| Interquartile 25% (IQ1) | 4.5% | 12.3% |
| Interquartile 75% (IQ3) | 10.1% | 22.5% |
| Interquartile Range (IQR) | 5.6% | 10.2% |
| Standard Deviation (Sample) | 5.1% | 8.9% |
| Standard Deviation (Population) | 5.1% | 8.8% |
Similar Demographics by Male Poverty
Demographics Similar to Immigrants from Ireland by Male Poverty
In terms of male poverty, the demographic groups most similar to Immigrants from Ireland are Assyrian/Chaldean/Syriac (9.1%, a difference of 0.080%), Filipino (9.2%, a difference of 0.67%), Maltese (9.1%, a difference of 0.75%), Immigrants from South Central Asia (9.3%, a difference of 1.5%), and Bulgarian (9.3%, a difference of 2.0%).
| Demographics | Rating | Rank | Male Poverty |
| Immigrants | India | 100.0 /100 | #1 | Exceptional 8.2% |
| Chinese | 100.0 /100 | #2 | Exceptional 8.7% |
| Thais | 100.0 /100 | #3 | Exceptional 8.7% |
| Immigrants | Taiwan | 100.0 /100 | #4 | Exceptional 8.9% |
| Maltese | 100.0 /100 | #5 | Exceptional 9.1% |
| Assyrians/Chaldeans/Syriacs | 99.9 /100 | #6 | Exceptional 9.1% |
| Immigrants | Ireland | 99.9 /100 | #7 | Exceptional 9.1% |
| Filipinos | 99.9 /100 | #8 | Exceptional 9.2% |
| Immigrants | South Central Asia | 99.9 /100 | #9 | Exceptional 9.3% |
| Bulgarians | 99.9 /100 | #10 | Exceptional 9.3% |
| Bolivians | 99.9 /100 | #11 | Exceptional 9.4% |
| Immigrants | Bolivia | 99.9 /100 | #12 | Exceptional 9.4% |
| Immigrants | Lithuania | 99.9 /100 | #13 | Exceptional 9.4% |
| Immigrants | North Macedonia | 99.8 /100 | #14 | Exceptional 9.4% |
| Bhutanese | 99.8 /100 | #15 | Exceptional 9.5% |
Demographics Similar to Creek by Male Poverty
In terms of male poverty, the demographic groups most similar to Creek are Immigrants from Bangladesh (14.1%, a difference of 0.070%), Senegalese (14.1%, a difference of 0.29%), Bahamian (14.1%, a difference of 0.39%), Immigrants from Caribbean (14.0%, a difference of 0.43%), and Immigrants from Senegal (14.0%, a difference of 0.49%).
| Demographics | Rating | Rank | Male Poverty |
| Immigrants | Guatemala | 0.0 /100 | #299 | Tragic 14.0% |
| Immigrants | Mexico | 0.0 /100 | #300 | Tragic 14.0% |
| Immigrants | Senegal | 0.0 /100 | #301 | Tragic 14.0% |
| Immigrants | Caribbean | 0.0 /100 | #302 | Tragic 14.0% |
| Bahamians | 0.0 /100 | #303 | Tragic 14.1% |
| Senegalese | 0.0 /100 | #304 | Tragic 14.1% |
| Immigrants | Bangladesh | 0.0 /100 | #305 | Tragic 14.1% |
| Creek | 0.0 /100 | #306 | Tragic 14.1% |
| Dutch West Indians | 0.0 /100 | #307 | Tragic 14.2% |
| Africans | 0.0 /100 | #308 | Tragic 14.2% |
| Somalis | 0.0 /100 | #309 | Tragic 14.3% |
| Seminole | 0.0 /100 | #310 | Tragic 14.3% |
| Hondurans | 0.0 /100 | #311 | Tragic 14.3% |
| Choctaw | 0.0 /100 | #312 | Tragic 14.4% |
| Immigrants | Somalia | 0.0 /100 | #313 | Tragic 14.6% |