Spanish American vs Creek Cognitive Disability
COMPARE
Spanish American
Creek
Cognitive Disability
Cognitive Disability Comparison
Spanish Americans
Creek
18.0%
COGNITIVE DISABILITY
0.4/ 100
METRIC RATING
265th/ 347
METRIC RANK
18.3%
COGNITIVE DISABILITY
0.0/ 100
METRIC RATING
300th/ 347
METRIC RANK
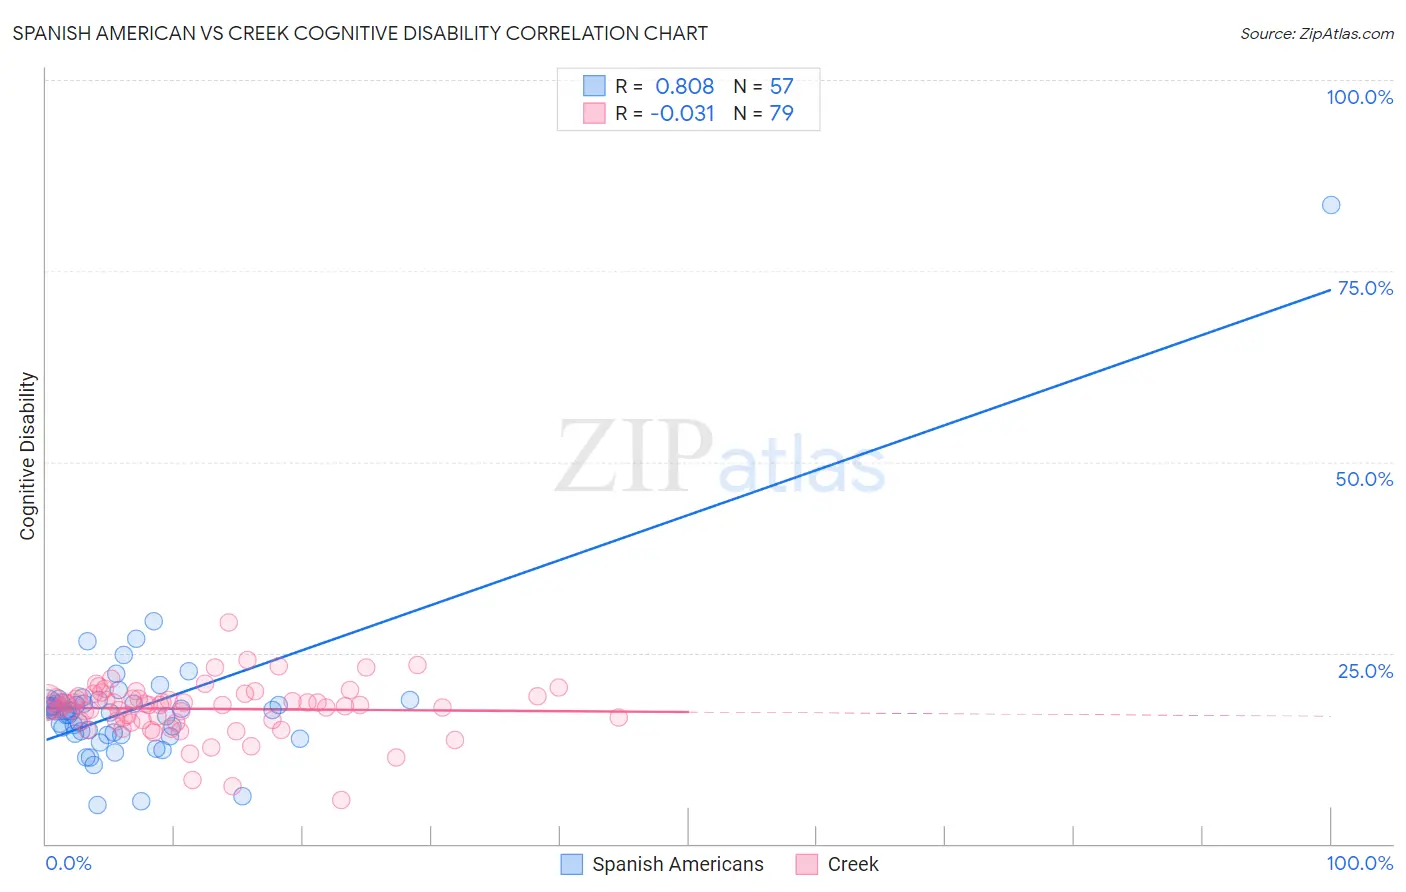
Spanish American vs Creek Cognitive Disability Correlation Chart
The statistical analysis conducted on geographies consisting of 103,167,969 people shows a very strong positive correlation between the proportion of Spanish Americans and percentage of population with cognitive disability in the United States with a correlation coefficient (R) of 0.808 and weighted average of 18.0%. Similarly, the statistical analysis conducted on geographies consisting of 178,450,672 people shows no correlation between the proportion of Creek and percentage of population with cognitive disability in the United States with a correlation coefficient (R) of -0.031 and weighted average of 18.3%, a difference of 1.7%.
Cognitive Disability Correlation Summary
| Measurement | Spanish American | Creek |
| Minimum | 5.1% | 5.7% |
| Maximum | 83.6% | 28.9% |
| Range | 78.6% | 23.2% |
| Mean | 17.8% | 17.7% |
| Median | 17.4% | 18.2% |
| Interquartile 25% (IQ1) | 14.4% | 16.1% |
| Interquartile 75% (IQ3) | 18.4% | 19.3% |
| Interquartile Range (IQR) | 4.1% | 3.2% |
| Standard Deviation (Sample) | 10.0% | 3.5% |
| Standard Deviation (Population) | 9.9% | 3.5% |
Similar Demographics by Cognitive Disability
Demographics Similar to Spanish Americans by Cognitive Disability
In terms of cognitive disability, the demographic groups most similar to Spanish Americans are Belizean (18.0%, a difference of 0.0%), Menominee (18.0%, a difference of 0.030%), Nepalese (18.0%, a difference of 0.060%), Cherokee (18.0%, a difference of 0.070%), and Immigrants from Barbados (17.9%, a difference of 0.090%).
| Demographics | Rating | Rank | Cognitive Disability |
| Immigrants | Armenia | 0.6 /100 | #258 | Tragic 17.9% |
| Ethiopians | 0.5 /100 | #259 | Tragic 17.9% |
| Immigrants | Belize | 0.5 /100 | #260 | Tragic 17.9% |
| Guamanians/Chamorros | 0.5 /100 | #261 | Tragic 17.9% |
| Sierra Leoneans | 0.4 /100 | #262 | Tragic 17.9% |
| Immigrants | Barbados | 0.4 /100 | #263 | Tragic 17.9% |
| Menominee | 0.4 /100 | #264 | Tragic 18.0% |
| Spanish Americans | 0.4 /100 | #265 | Tragic 18.0% |
| Belizeans | 0.4 /100 | #266 | Tragic 18.0% |
| Nepalese | 0.3 /100 | #267 | Tragic 18.0% |
| Cherokee | 0.3 /100 | #268 | Tragic 18.0% |
| Hondurans | 0.3 /100 | #269 | Tragic 18.0% |
| Immigrants | Bahamas | 0.3 /100 | #270 | Tragic 18.0% |
| Potawatomi | 0.2 /100 | #271 | Tragic 18.0% |
| Immigrants | Honduras | 0.2 /100 | #272 | Tragic 18.0% |
Demographics Similar to Creek by Cognitive Disability
In terms of cognitive disability, the demographic groups most similar to Creek are Ghanaian (18.3%, a difference of 0.020%), Blackfeet (18.3%, a difference of 0.060%), Japanese (18.3%, a difference of 0.060%), Immigrants from Ghana (18.3%, a difference of 0.14%), and Immigrants from Burma/Myanmar (18.2%, a difference of 0.20%).
| Demographics | Rating | Rank | Cognitive Disability |
| Central American Indians | 0.1 /100 | #293 | Tragic 18.2% |
| British West Indians | 0.1 /100 | #294 | Tragic 18.2% |
| German Russians | 0.0 /100 | #295 | Tragic 18.2% |
| Immigrants | Burma/Myanmar | 0.0 /100 | #296 | Tragic 18.2% |
| Blackfeet | 0.0 /100 | #297 | Tragic 18.3% |
| Japanese | 0.0 /100 | #298 | Tragic 18.3% |
| Ghanaians | 0.0 /100 | #299 | Tragic 18.3% |
| Creek | 0.0 /100 | #300 | Tragic 18.3% |
| Immigrants | Ghana | 0.0 /100 | #301 | Tragic 18.3% |
| Barbadians | 0.0 /100 | #302 | Tragic 18.3% |
| Immigrants | Kenya | 0.0 /100 | #303 | Tragic 18.3% |
| Immigrants | Eritrea | 0.0 /100 | #304 | Tragic 18.3% |
| Colville | 0.0 /100 | #305 | Tragic 18.3% |
| Seminole | 0.0 /100 | #306 | Tragic 18.3% |
| Ugandans | 0.0 /100 | #307 | Tragic 18.3% |