Immigrants from Iran vs Creek Male Poverty
COMPARE
Immigrants from Iran
Creek
Male Poverty
Male Poverty Comparison
Immigrants from Iran
Creek
9.9%
MALE POVERTY
99.1/ 100
METRIC RATING
42nd/ 347
METRIC RANK
14.1%
MALE POVERTY
0.0/ 100
METRIC RATING
306th/ 347
METRIC RANK
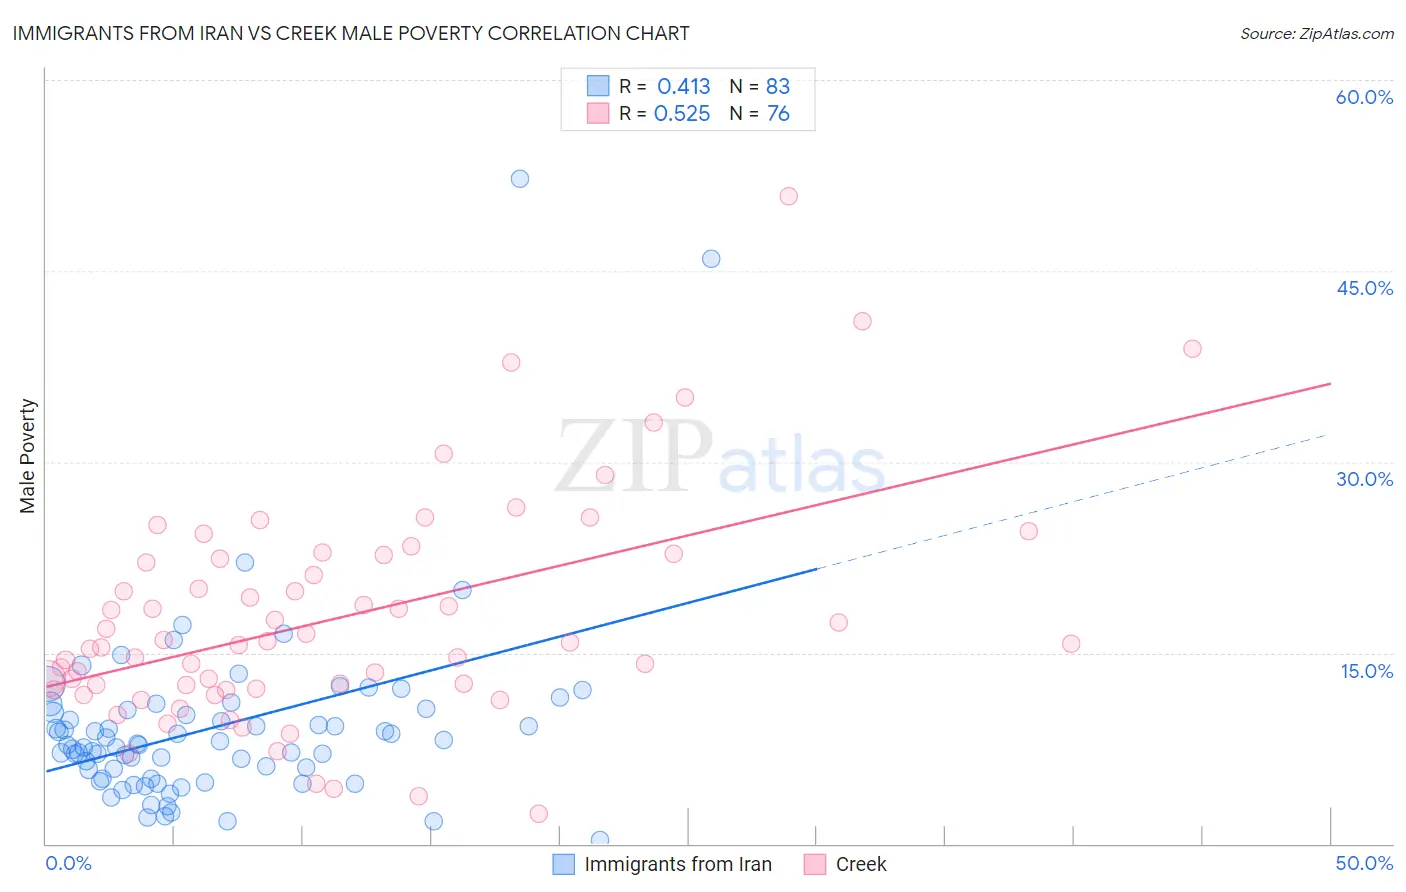
Immigrants from Iran vs Creek Male Poverty Correlation Chart
The statistical analysis conducted on geographies consisting of 279,773,882 people shows a moderate positive correlation between the proportion of Immigrants from Iran and poverty level among males in the United States with a correlation coefficient (R) of 0.413 and weighted average of 9.9%. Similarly, the statistical analysis conducted on geographies consisting of 178,404,623 people shows a substantial positive correlation between the proportion of Creek and poverty level among males in the United States with a correlation coefficient (R) of 0.525 and weighted average of 14.1%, a difference of 42.5%.
Male Poverty Correlation Summary
| Measurement | Immigrants from Iran | Creek |
| Minimum | 0.33% | 2.3% |
| Maximum | 52.3% | 50.8% |
| Range | 51.9% | 48.5% |
| Mean | 9.2% | 17.8% |
| Median | 7.8% | 15.7% |
| Interquartile 25% (IQ1) | 5.1% | 12.3% |
| Interquartile 75% (IQ3) | 10.5% | 22.5% |
| Interquartile Range (IQR) | 5.4% | 10.2% |
| Standard Deviation (Sample) | 7.5% | 8.9% |
| Standard Deviation (Population) | 7.4% | 8.8% |
Similar Demographics by Male Poverty
Demographics Similar to Immigrants from Iran by Male Poverty
In terms of male poverty, the demographic groups most similar to Immigrants from Iran are Korean (9.9%, a difference of 0.24%), Immigrants from Moldova (9.9%, a difference of 0.26%), Cypriot (9.9%, a difference of 0.34%), Immigrants from Pakistan (9.9%, a difference of 0.42%), and Russian (9.9%, a difference of 0.42%).
| Demographics | Rating | Rank | Male Poverty |
| Iranians | 99.4 /100 | #35 | Exceptional 9.8% |
| Czechs | 99.4 /100 | #36 | Exceptional 9.8% |
| Immigrants | Greece | 99.3 /100 | #37 | Exceptional 9.8% |
| Immigrants | Pakistan | 99.2 /100 | #38 | Exceptional 9.9% |
| Russians | 99.2 /100 | #39 | Exceptional 9.9% |
| Cypriots | 99.2 /100 | #40 | Exceptional 9.9% |
| Koreans | 99.2 /100 | #41 | Exceptional 9.9% |
| Immigrants | Iran | 99.1 /100 | #42 | Exceptional 9.9% |
| Immigrants | Moldova | 99.0 /100 | #43 | Exceptional 9.9% |
| Immigrants | Romania | 98.9 /100 | #44 | Exceptional 9.9% |
| Immigrants | Serbia | 98.9 /100 | #45 | Exceptional 10.0% |
| Turks | 98.9 /100 | #46 | Exceptional 10.0% |
| Immigrants | Singapore | 98.8 /100 | #47 | Exceptional 10.0% |
| Immigrants | Japan | 98.8 /100 | #48 | Exceptional 10.0% |
| Slovenes | 98.8 /100 | #49 | Exceptional 10.0% |
Demographics Similar to Creek by Male Poverty
In terms of male poverty, the demographic groups most similar to Creek are Immigrants from Bangladesh (14.1%, a difference of 0.070%), Senegalese (14.1%, a difference of 0.29%), Bahamian (14.1%, a difference of 0.39%), Immigrants from Caribbean (14.0%, a difference of 0.43%), and Immigrants from Senegal (14.0%, a difference of 0.49%).
| Demographics | Rating | Rank | Male Poverty |
| Immigrants | Guatemala | 0.0 /100 | #299 | Tragic 14.0% |
| Immigrants | Mexico | 0.0 /100 | #300 | Tragic 14.0% |
| Immigrants | Senegal | 0.0 /100 | #301 | Tragic 14.0% |
| Immigrants | Caribbean | 0.0 /100 | #302 | Tragic 14.0% |
| Bahamians | 0.0 /100 | #303 | Tragic 14.1% |
| Senegalese | 0.0 /100 | #304 | Tragic 14.1% |
| Immigrants | Bangladesh | 0.0 /100 | #305 | Tragic 14.1% |
| Creek | 0.0 /100 | #306 | Tragic 14.1% |
| Dutch West Indians | 0.0 /100 | #307 | Tragic 14.2% |
| Africans | 0.0 /100 | #308 | Tragic 14.2% |
| Somalis | 0.0 /100 | #309 | Tragic 14.3% |
| Seminole | 0.0 /100 | #310 | Tragic 14.3% |
| Hondurans | 0.0 /100 | #311 | Tragic 14.3% |
| Choctaw | 0.0 /100 | #312 | Tragic 14.4% |
| Immigrants | Somalia | 0.0 /100 | #313 | Tragic 14.6% |