Spanish American Indian vs Guamanian/Chamorro Female Poverty
COMPARE
Spanish American Indian
Guamanian/Chamorro
Female Poverty
Female Poverty Comparison
Spanish American Indians
Guamanians/Chamorros
15.3%
FEMALE POVERTY
0.3/ 100
METRIC RATING
245th/ 347
METRIC RANK
13.3%
FEMALE POVERTY
62.4/ 100
METRIC RATING
162nd/ 347
METRIC RANK
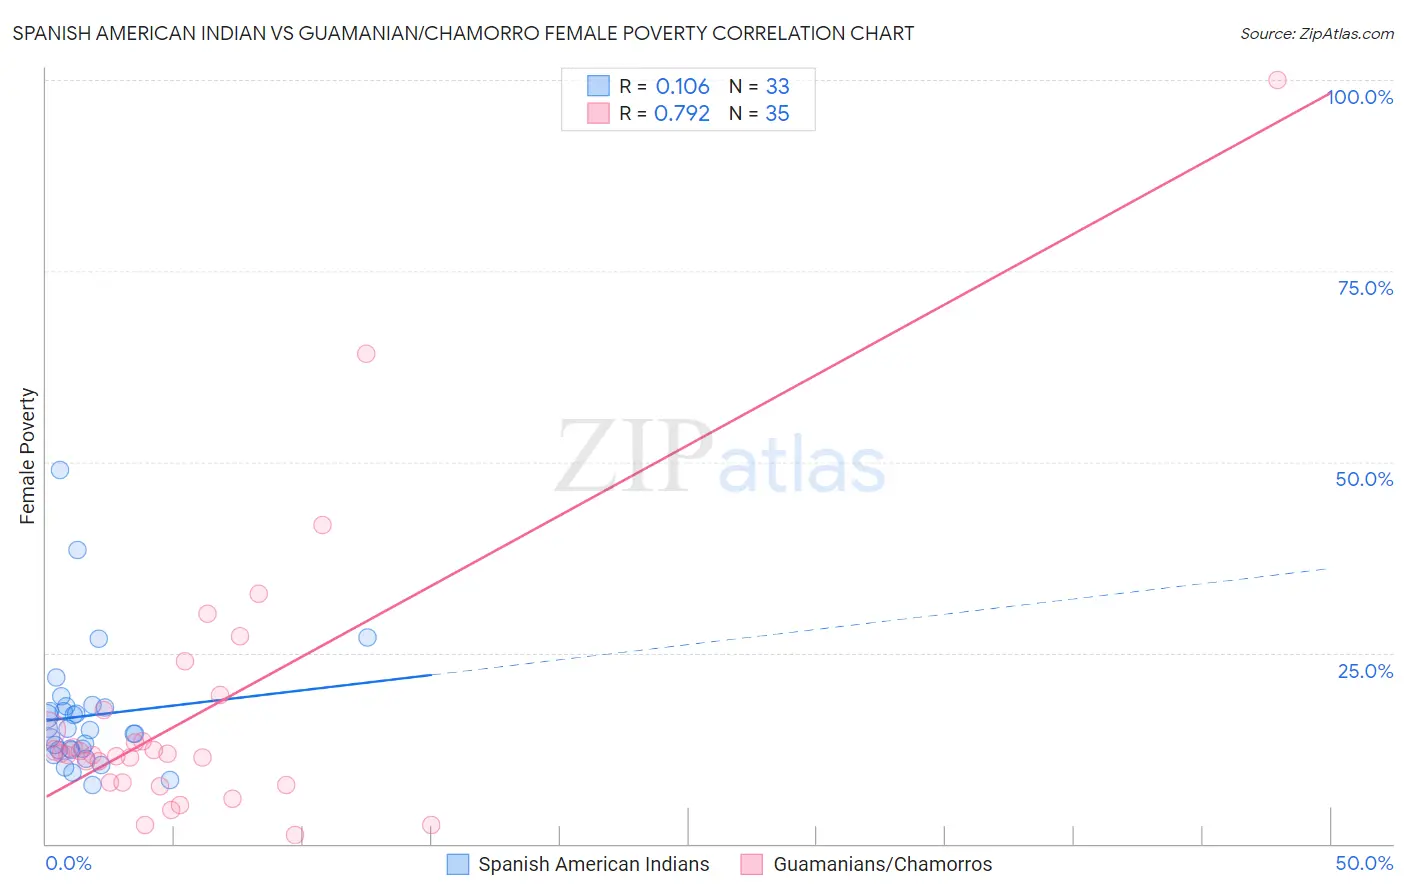
Spanish American Indian vs Guamanian/Chamorro Female Poverty Correlation Chart
The statistical analysis conducted on geographies consisting of 73,136,112 people shows a poor positive correlation between the proportion of Spanish American Indians and poverty level among females in the United States with a correlation coefficient (R) of 0.106 and weighted average of 15.3%. Similarly, the statistical analysis conducted on geographies consisting of 221,860,928 people shows a strong positive correlation between the proportion of Guamanians/Chamorros and poverty level among females in the United States with a correlation coefficient (R) of 0.792 and weighted average of 13.3%, a difference of 15.2%.
Female Poverty Correlation Summary
| Measurement | Spanish American Indian | Guamanian/Chamorro |
| Minimum | 7.6% | 1.2% |
| Maximum | 48.9% | 100.0% |
| Range | 41.2% | 98.8% |
| Mean | 16.8% | 17.2% |
| Median | 15.0% | 11.7% |
| Interquartile 25% (IQ1) | 12.3% | 8.0% |
| Interquartile 75% (IQ3) | 17.9% | 17.6% |
| Interquartile Range (IQR) | 5.6% | 9.6% |
| Standard Deviation (Sample) | 8.3% | 18.9% |
| Standard Deviation (Population) | 8.2% | 18.6% |
Similar Demographics by Female Poverty
Demographics Similar to Spanish American Indians by Female Poverty
In terms of female poverty, the demographic groups most similar to Spanish American Indians are Cuban (15.3%, a difference of 0.050%), Potawatomi (15.3%, a difference of 0.060%), Immigrants from Ghana (15.3%, a difference of 0.060%), Ecuadorian (15.3%, a difference of 0.090%), and Nicaraguan (15.3%, a difference of 0.15%).
| Demographics | Rating | Rank | Female Poverty |
| Immigrants | Armenia | 0.6 /100 | #238 | Tragic 15.1% |
| Immigrants | Middle Africa | 0.5 /100 | #239 | Tragic 15.2% |
| Sudanese | 0.5 /100 | #240 | Tragic 15.2% |
| Immigrants | Sudan | 0.4 /100 | #241 | Tragic 15.2% |
| Nepalese | 0.4 /100 | #242 | Tragic 15.2% |
| Nicaraguans | 0.3 /100 | #243 | Tragic 15.3% |
| Ecuadorians | 0.3 /100 | #244 | Tragic 15.3% |
| Spanish American Indians | 0.3 /100 | #245 | Tragic 15.3% |
| Cubans | 0.3 /100 | #246 | Tragic 15.3% |
| Potawatomi | 0.3 /100 | #247 | Tragic 15.3% |
| Immigrants | Ghana | 0.3 /100 | #248 | Tragic 15.3% |
| Salvadorans | 0.3 /100 | #249 | Tragic 15.3% |
| Immigrants | Western Africa | 0.3 /100 | #250 | Tragic 15.3% |
| Immigrants | Trinidad and Tobago | 0.3 /100 | #251 | Tragic 15.4% |
| Immigrants | Burma/Myanmar | 0.3 /100 | #252 | Tragic 15.4% |
Demographics Similar to Guamanians/Chamorros by Female Poverty
In terms of female poverty, the demographic groups most similar to Guamanians/Chamorros are Immigrants from Albania (13.3%, a difference of 0.0%), Immigrants from Ethiopia (13.3%, a difference of 0.010%), Ethiopian (13.3%, a difference of 0.010%), Immigrants from Nepal (13.3%, a difference of 0.030%), and Scotch-Irish (13.3%, a difference of 0.030%).
| Demographics | Rating | Rank | Female Poverty |
| Hungarians | 70.1 /100 | #155 | Good 13.2% |
| Immigrants | Bosnia and Herzegovina | 69.7 /100 | #156 | Good 13.2% |
| Immigrants | Northern Africa | 68.8 /100 | #157 | Good 13.2% |
| Pennsylvania Germans | 67.3 /100 | #158 | Good 13.2% |
| Costa Ricans | 63.6 /100 | #159 | Good 13.3% |
| Immigrants | Nepal | 62.7 /100 | #160 | Good 13.3% |
| Immigrants | Ethiopia | 62.5 /100 | #161 | Good 13.3% |
| Guamanians/Chamorros | 62.4 /100 | #162 | Good 13.3% |
| Immigrants | Albania | 62.4 /100 | #163 | Good 13.3% |
| Ethiopians | 62.3 /100 | #164 | Good 13.3% |
| Scotch-Irish | 62.1 /100 | #165 | Good 13.3% |
| Immigrants | Oceania | 59.7 /100 | #166 | Average 13.3% |
| Immigrants | Chile | 57.4 /100 | #167 | Average 13.3% |
| Aleuts | 56.7 /100 | #168 | Average 13.4% |
| Lebanese | 55.9 /100 | #169 | Average 13.4% |