Spanish American Indian vs Scottish Master's Degree
COMPARE
Spanish American Indian
Scottish
Master's Degree
Master's Degree Comparison
Spanish American Indians
Scottish
9.6%
MASTER'S DEGREE
0.0/ 100
METRIC RATING
339th/ 347
METRIC RANK
15.2%
MASTER'S DEGREE
62.7/ 100
METRIC RATING
169th/ 347
METRIC RANK
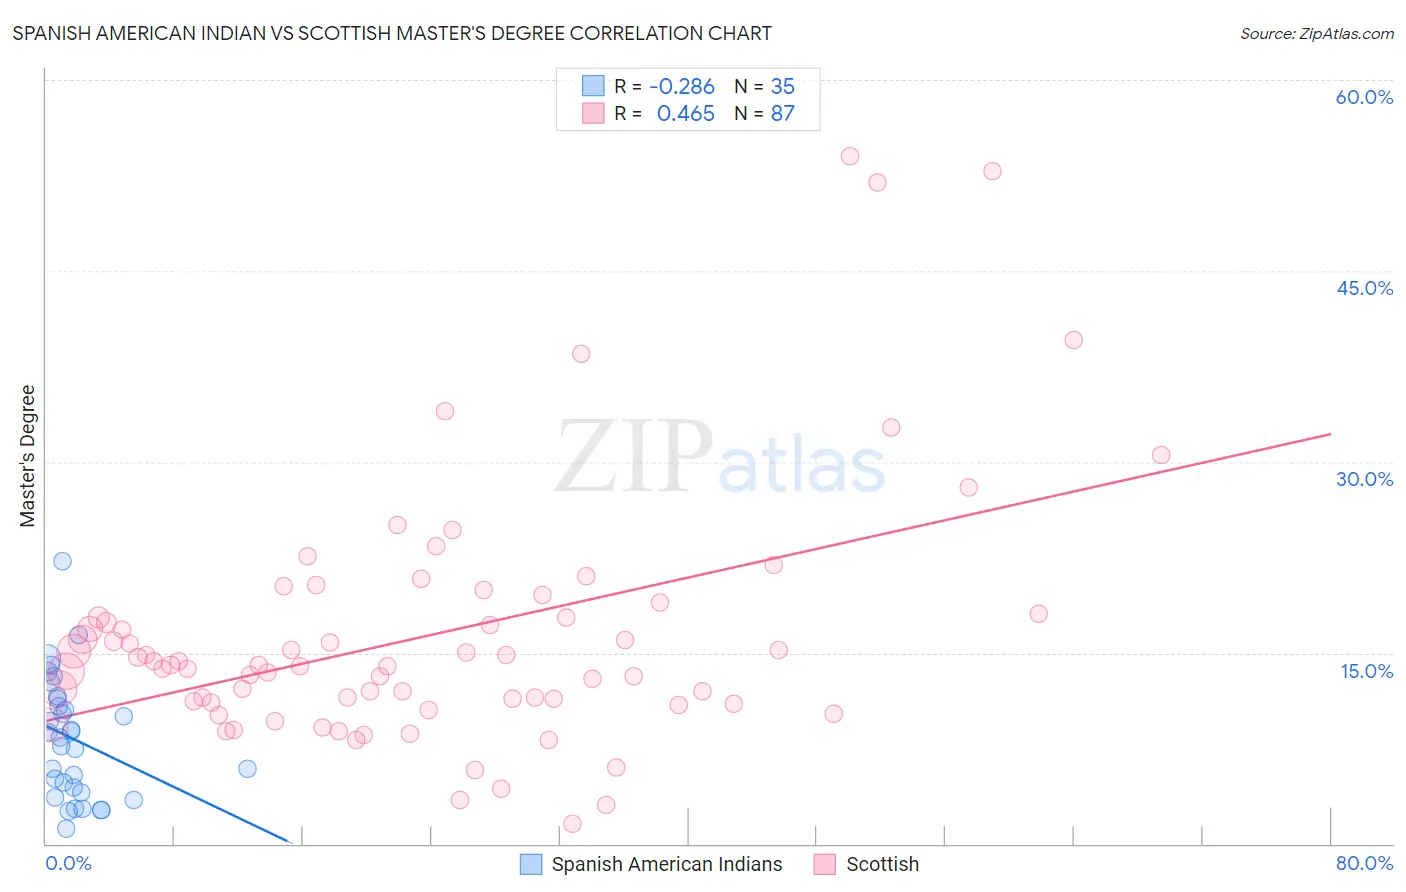
Spanish American Indian vs Scottish Master's Degree Correlation Chart
The statistical analysis conducted on geographies consisting of 73,142,188 people shows a weak negative correlation between the proportion of Spanish American Indians and percentage of population with at least master's degree education in the United States with a correlation coefficient (R) of -0.286 and weighted average of 9.6%. Similarly, the statistical analysis conducted on geographies consisting of 566,344,578 people shows a moderate positive correlation between the proportion of Scottish and percentage of population with at least master's degree education in the United States with a correlation coefficient (R) of 0.465 and weighted average of 15.2%, a difference of 58.4%.
Master's Degree Correlation Summary
| Measurement | Spanish American Indian | Scottish |
| Minimum | 1.2% | 1.6% |
| Maximum | 22.2% | 54.0% |
| Range | 21.0% | 52.4% |
| Mean | 8.2% | 16.4% |
| Median | 8.4% | 14.0% |
| Interquartile 25% (IQ1) | 4.1% | 11.1% |
| Interquartile 75% (IQ3) | 11.4% | 18.0% |
| Interquartile Range (IQR) | 7.3% | 7.0% |
| Standard Deviation (Sample) | 4.8% | 9.9% |
| Standard Deviation (Population) | 4.7% | 9.8% |
Similar Demographics by Master's Degree
Demographics Similar to Spanish American Indians by Master's Degree
In terms of master's degree, the demographic groups most similar to Spanish American Indians are Yakama (9.5%, a difference of 1.2%), Tohono O'odham (9.7%, a difference of 1.3%), Mexican (9.7%, a difference of 1.4%), Navajo (9.4%, a difference of 1.6%), and Immigrants from Mexico (9.3%, a difference of 2.9%).
| Demographics | Rating | Rank | Master's Degree |
| Immigrants | Azores | 0.0 /100 | #332 | Tragic 10.2% |
| Menominee | 0.0 /100 | #333 | Tragic 10.2% |
| Arapaho | 0.0 /100 | #334 | Tragic 10.0% |
| Immigrants | Central America | 0.0 /100 | #335 | Tragic 10.0% |
| Natives/Alaskans | 0.0 /100 | #336 | Tragic 9.9% |
| Mexicans | 0.0 /100 | #337 | Tragic 9.7% |
| Tohono O'odham | 0.0 /100 | #338 | Tragic 9.7% |
| Spanish American Indians | 0.0 /100 | #339 | Tragic 9.6% |
| Yakama | 0.0 /100 | #340 | Tragic 9.5% |
| Navajo | 0.0 /100 | #341 | Tragic 9.4% |
| Immigrants | Mexico | 0.0 /100 | #342 | Tragic 9.3% |
| Lumbee | 0.0 /100 | #343 | Tragic 9.3% |
| Pima | 0.0 /100 | #344 | Tragic 9.2% |
| Yuman | 0.0 /100 | #345 | Tragic 9.2% |
| Yup'ik | 0.0 /100 | #346 | Tragic 8.5% |
Demographics Similar to Scottish by Master's Degree
In terms of master's degree, the demographic groups most similar to Scottish are Immigrants from North Macedonia (15.2%, a difference of 0.25%), Senegalese (15.2%, a difference of 0.39%), Swedish (15.2%, a difference of 0.46%), Immigrants from Kenya (15.3%, a difference of 0.54%), and Colombian (15.3%, a difference of 0.58%).
| Demographics | Rating | Rank | Master's Degree |
| Peruvians | 68.7 /100 | #162 | Good 15.3% |
| Uruguayans | 67.1 /100 | #163 | Good 15.3% |
| Colombians | 66.9 /100 | #164 | Good 15.3% |
| Immigrants | Kenya | 66.6 /100 | #165 | Good 15.3% |
| Swedes | 66.1 /100 | #166 | Good 15.2% |
| Senegalese | 65.6 /100 | #167 | Good 15.2% |
| Immigrants | North Macedonia | 64.5 /100 | #168 | Good 15.2% |
| Scottish | 62.7 /100 | #169 | Good 15.2% |
| Irish | 56.3 /100 | #170 | Average 15.0% |
| Immigrants | Ghana | 53.6 /100 | #171 | Average 15.0% |
| Immigrants | Uruguay | 52.8 /100 | #172 | Average 15.0% |
| Costa Ricans | 52.5 /100 | #173 | Average 15.0% |
| Slovaks | 50.0 /100 | #174 | Average 14.9% |
| Immigrants | Peru | 49.6 /100 | #175 | Average 14.9% |
| Nigerians | 48.6 /100 | #176 | Average 14.9% |