Spanish American Indian vs Immigrants from South Central Asia Poverty
COMPARE
Spanish American Indian
Immigrants from South Central Asia
Poverty
Poverty Comparison
Spanish American Indians
Immigrants from South Central Asia
14.2%
POVERTY
0.2/ 100
METRIC RATING
252nd/ 347
METRIC RANK
10.2%
POVERTY
99.9/ 100
METRIC RATING
9th/ 347
METRIC RANK
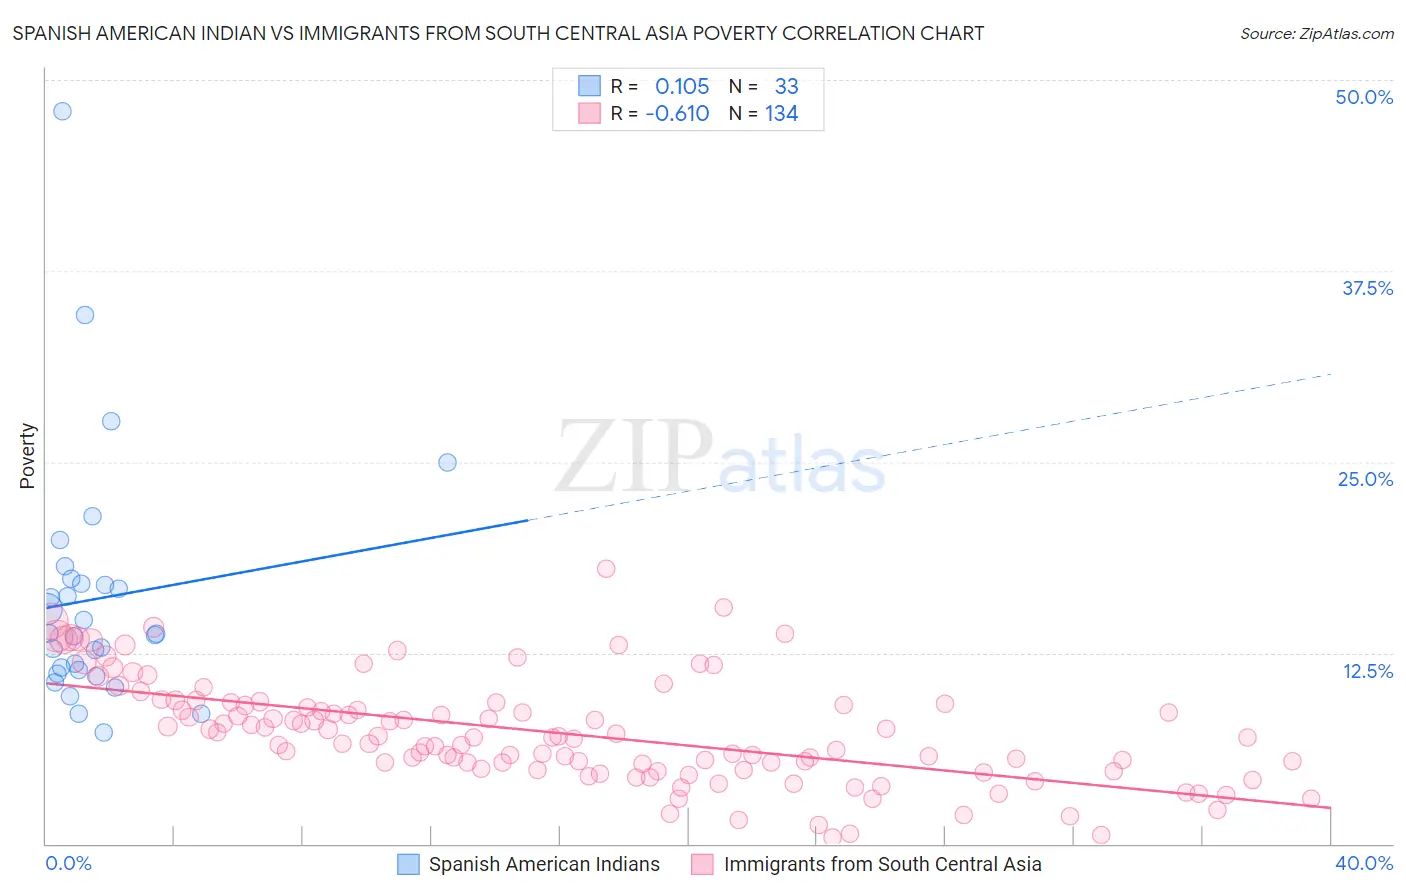
Spanish American Indian vs Immigrants from South Central Asia Poverty Correlation Chart
The statistical analysis conducted on geographies consisting of 73,142,105 people shows a poor positive correlation between the proportion of Spanish American Indians and poverty level in the United States with a correlation coefficient (R) of 0.105 and weighted average of 14.2%. Similarly, the statistical analysis conducted on geographies consisting of 472,664,539 people shows a significant negative correlation between the proportion of Immigrants from South Central Asia and poverty level in the United States with a correlation coefficient (R) of -0.610 and weighted average of 10.2%, a difference of 39.4%.
Poverty Correlation Summary
| Measurement | Spanish American Indian | Immigrants from South Central Asia |
| Minimum | 7.3% | 0.44% |
| Maximum | 48.0% | 18.0% |
| Range | 40.7% | 17.6% |
| Mean | 16.0% | 7.3% |
| Median | 13.8% | 7.0% |
| Interquartile 25% (IQ1) | 11.3% | 4.9% |
| Interquartile 75% (IQ3) | 17.2% | 9.2% |
| Interquartile Range (IQR) | 5.9% | 4.2% |
| Standard Deviation (Sample) | 8.1% | 3.4% |
| Standard Deviation (Population) | 8.0% | 3.4% |
Similar Demographics by Poverty
Demographics Similar to Spanish American Indians by Poverty
In terms of poverty, the demographic groups most similar to Spanish American Indians are Immigrants from Trinidad and Tobago (14.2%, a difference of 0.10%), Immigrants from Burma/Myanmar (14.2%, a difference of 0.11%), Cree (14.2%, a difference of 0.20%), Immigrants from El Salvador (14.3%, a difference of 0.36%), and Immigrants from Ecuador (14.3%, a difference of 0.45%).
| Demographics | Rating | Rank | Poverty |
| Immigrants | Sudan | 0.3 /100 | #245 | Tragic 14.1% |
| Potawatomi | 0.3 /100 | #246 | Tragic 14.1% |
| Liberians | 0.2 /100 | #247 | Tragic 14.1% |
| Immigrants | Western Africa | 0.2 /100 | #248 | Tragic 14.1% |
| Immigrants | Ghana | 0.2 /100 | #249 | Tragic 14.2% |
| Cree | 0.2 /100 | #250 | Tragic 14.2% |
| Immigrants | Burma/Myanmar | 0.2 /100 | #251 | Tragic 14.2% |
| Spanish American Indians | 0.2 /100 | #252 | Tragic 14.2% |
| Immigrants | Trinidad and Tobago | 0.2 /100 | #253 | Tragic 14.2% |
| Immigrants | El Salvador | 0.1 /100 | #254 | Tragic 14.3% |
| Immigrants | Ecuador | 0.1 /100 | #255 | Tragic 14.3% |
| Mexican American Indians | 0.1 /100 | #256 | Tragic 14.3% |
| Trinidadians and Tobagonians | 0.1 /100 | #257 | Tragic 14.3% |
| Ottawa | 0.1 /100 | #258 | Tragic 14.3% |
| Immigrants | Nicaragua | 0.1 /100 | #259 | Tragic 14.3% |
Demographics Similar to Immigrants from South Central Asia by Poverty
In terms of poverty, the demographic groups most similar to Immigrants from South Central Asia are Bulgarian (10.2%, a difference of 0.41%), Maltese (10.2%, a difference of 0.45%), Filipino (10.1%, a difference of 0.87%), Assyrian/Chaldean/Syriac (10.1%, a difference of 1.0%), and Immigrants from Ireland (10.1%, a difference of 1.2%).
| Demographics | Rating | Rank | Poverty |
| Chinese | 100.0 /100 | #2 | Exceptional 9.5% |
| Thais | 100.0 /100 | #3 | Exceptional 9.6% |
| Immigrants | Taiwan | 100.0 /100 | #4 | Exceptional 9.7% |
| Immigrants | Ireland | 99.9 /100 | #5 | Exceptional 10.1% |
| Assyrians/Chaldeans/Syriacs | 99.9 /100 | #6 | Exceptional 10.1% |
| Filipinos | 99.9 /100 | #7 | Exceptional 10.1% |
| Maltese | 99.9 /100 | #8 | Exceptional 10.2% |
| Immigrants | South Central Asia | 99.9 /100 | #9 | Exceptional 10.2% |
| Bulgarians | 99.9 /100 | #10 | Exceptional 10.2% |
| Immigrants | Lithuania | 99.9 /100 | #11 | Exceptional 10.3% |
| Bhutanese | 99.8 /100 | #12 | Exceptional 10.4% |
| Immigrants | Hong Kong | 99.8 /100 | #13 | Exceptional 10.4% |
| Immigrants | Bolivia | 99.8 /100 | #14 | Exceptional 10.4% |
| Bolivians | 99.8 /100 | #15 | Exceptional 10.4% |
| Lithuanians | 99.8 /100 | #16 | Exceptional 10.5% |