Armenian vs Immigrants from South Central Asia Poverty
COMPARE
Armenian
Immigrants from South Central Asia
Poverty
Poverty Comparison
Armenians
Immigrants from South Central Asia
12.1%
POVERTY
67.6/ 100
METRIC RATING
152nd/ 347
METRIC RANK
10.2%
POVERTY
99.9/ 100
METRIC RATING
9th/ 347
METRIC RANK
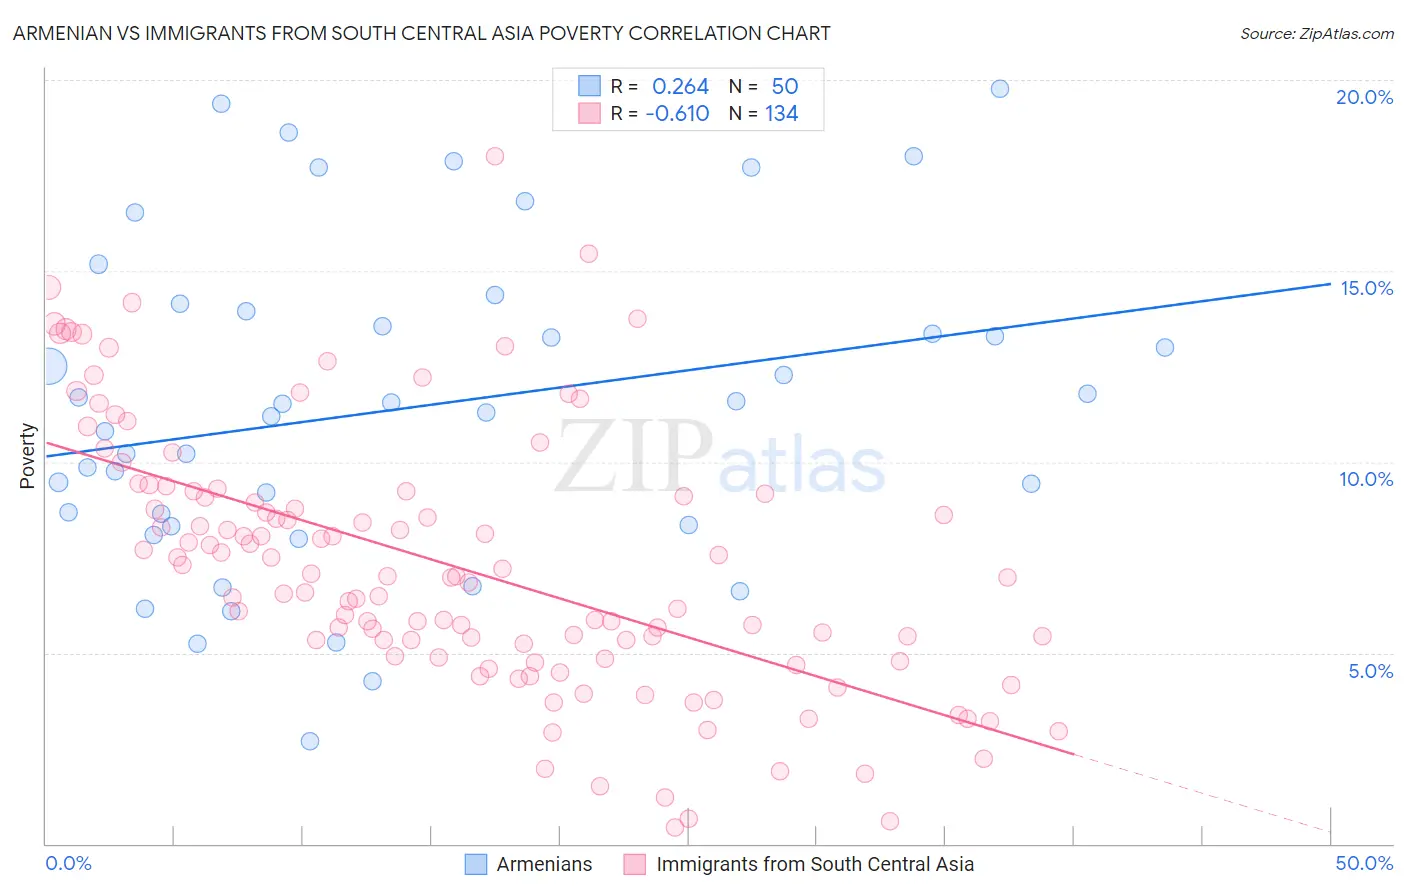
Armenian vs Immigrants from South Central Asia Poverty Correlation Chart
The statistical analysis conducted on geographies consisting of 310,820,657 people shows a weak positive correlation between the proportion of Armenians and poverty level in the United States with a correlation coefficient (R) of 0.264 and weighted average of 12.1%. Similarly, the statistical analysis conducted on geographies consisting of 472,664,539 people shows a significant negative correlation between the proportion of Immigrants from South Central Asia and poverty level in the United States with a correlation coefficient (R) of -0.610 and weighted average of 10.2%, a difference of 18.6%.
Poverty Correlation Summary
| Measurement | Armenian | Immigrants from South Central Asia |
| Minimum | 2.7% | 0.44% |
| Maximum | 19.8% | 18.0% |
| Range | 17.1% | 17.6% |
| Mean | 11.4% | 7.3% |
| Median | 11.4% | 7.0% |
| Interquartile 25% (IQ1) | 8.3% | 4.9% |
| Interquartile 75% (IQ3) | 13.9% | 9.2% |
| Interquartile Range (IQR) | 5.6% | 4.2% |
| Standard Deviation (Sample) | 4.2% | 3.4% |
| Standard Deviation (Population) | 4.2% | 3.4% |
Similar Demographics by Poverty
Demographics Similar to Armenians by Poverty
In terms of poverty, the demographic groups most similar to Armenians are Immigrants from Northern Africa (12.1%, a difference of 0.41%), Guamanian/Chamorro (12.1%, a difference of 0.41%), Hungarian (12.2%, a difference of 0.44%), Samoan (12.0%, a difference of 0.50%), and Immigrants from Kazakhstan (12.0%, a difference of 0.55%).
| Demographics | Rating | Rank | Poverty |
| Syrians | 75.1 /100 | #145 | Good 12.0% |
| Afghans | 74.9 /100 | #146 | Good 12.0% |
| Immigrants | Bosnia and Herzegovina | 73.7 /100 | #147 | Good 12.0% |
| Immigrants | Germany | 72.7 /100 | #148 | Good 12.0% |
| Immigrants | Malaysia | 72.7 /100 | #149 | Good 12.0% |
| Immigrants | Kazakhstan | 72.3 /100 | #150 | Good 12.0% |
| Samoans | 71.9 /100 | #151 | Good 12.0% |
| Armenians | 67.6 /100 | #152 | Good 12.1% |
| Immigrants | Northern Africa | 63.9 /100 | #153 | Good 12.1% |
| Guamanians/Chamorros | 63.9 /100 | #154 | Good 12.1% |
| Hungarians | 63.6 /100 | #155 | Good 12.2% |
| Scotch-Irish | 62.6 /100 | #156 | Good 12.2% |
| Costa Ricans | 62.2 /100 | #157 | Good 12.2% |
| Taiwanese | 61.8 /100 | #158 | Good 12.2% |
| Pennsylvania Germans | 60.8 /100 | #159 | Good 12.2% |
Demographics Similar to Immigrants from South Central Asia by Poverty
In terms of poverty, the demographic groups most similar to Immigrants from South Central Asia are Bulgarian (10.2%, a difference of 0.41%), Maltese (10.2%, a difference of 0.45%), Filipino (10.1%, a difference of 0.87%), Assyrian/Chaldean/Syriac (10.1%, a difference of 1.0%), and Immigrants from Ireland (10.1%, a difference of 1.2%).
| Demographics | Rating | Rank | Poverty |
| Chinese | 100.0 /100 | #2 | Exceptional 9.5% |
| Thais | 100.0 /100 | #3 | Exceptional 9.6% |
| Immigrants | Taiwan | 100.0 /100 | #4 | Exceptional 9.7% |
| Immigrants | Ireland | 99.9 /100 | #5 | Exceptional 10.1% |
| Assyrians/Chaldeans/Syriacs | 99.9 /100 | #6 | Exceptional 10.1% |
| Filipinos | 99.9 /100 | #7 | Exceptional 10.1% |
| Maltese | 99.9 /100 | #8 | Exceptional 10.2% |
| Immigrants | South Central Asia | 99.9 /100 | #9 | Exceptional 10.2% |
| Bulgarians | 99.9 /100 | #10 | Exceptional 10.2% |
| Immigrants | Lithuania | 99.9 /100 | #11 | Exceptional 10.3% |
| Bhutanese | 99.8 /100 | #12 | Exceptional 10.4% |
| Immigrants | Hong Kong | 99.8 /100 | #13 | Exceptional 10.4% |
| Immigrants | Bolivia | 99.8 /100 | #14 | Exceptional 10.4% |
| Bolivians | 99.8 /100 | #15 | Exceptional 10.4% |
| Lithuanians | 99.8 /100 | #16 | Exceptional 10.5% |