Spanish American Indian vs Latvian Poverty
COMPARE
Spanish American Indian
Latvian
Poverty
Poverty Comparison
Spanish American Indians
Latvians
14.2%
POVERTY
0.2/ 100
METRIC RATING
252nd/ 347
METRIC RANK
10.5%
POVERTY
99.8/ 100
METRIC RATING
18th/ 347
METRIC RANK
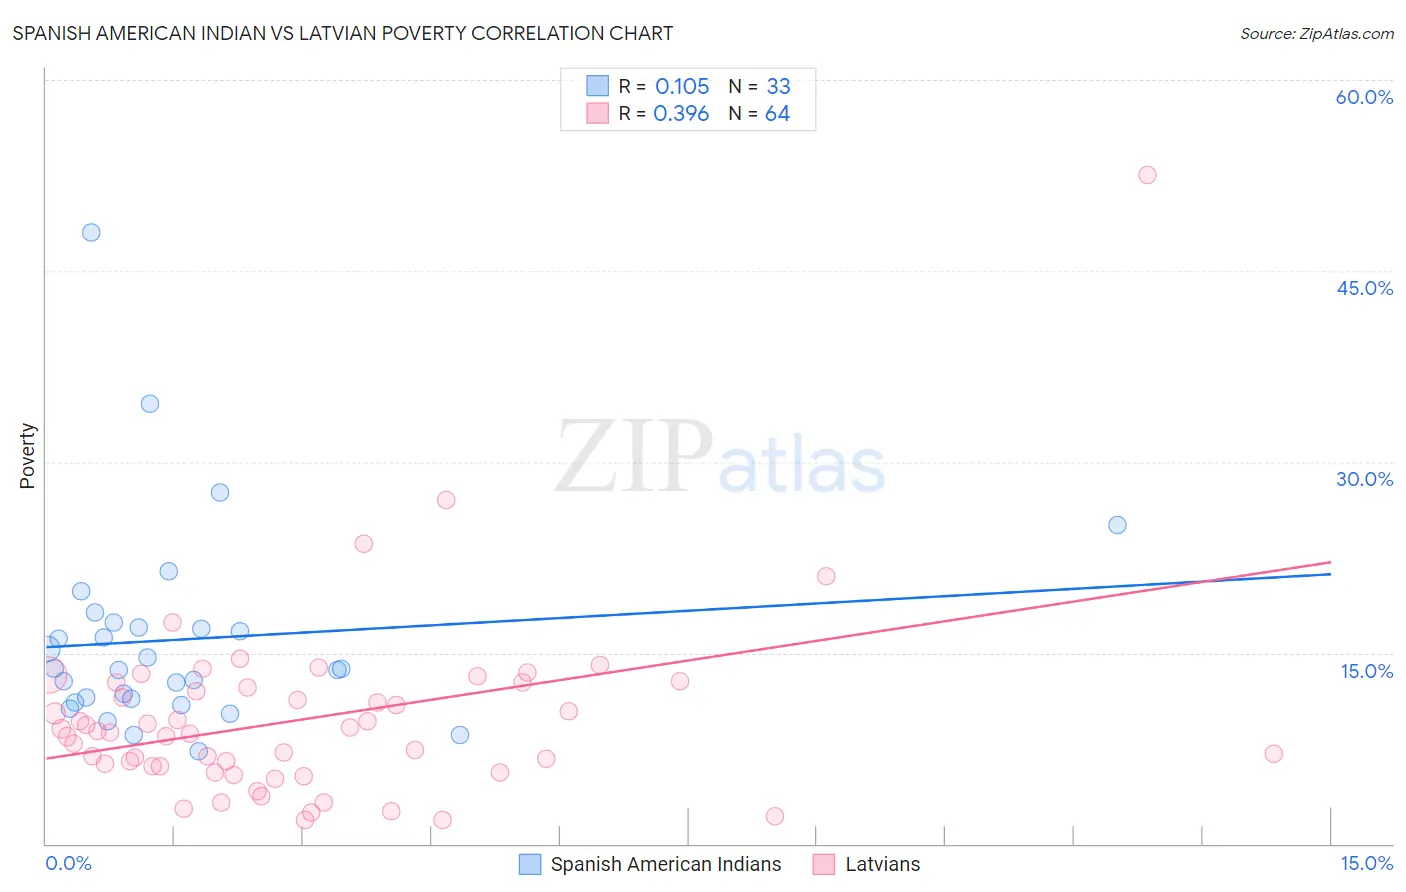
Spanish American Indian vs Latvian Poverty Correlation Chart
The statistical analysis conducted on geographies consisting of 73,142,105 people shows a poor positive correlation between the proportion of Spanish American Indians and poverty level in the United States with a correlation coefficient (R) of 0.105 and weighted average of 14.2%. Similarly, the statistical analysis conducted on geographies consisting of 220,650,145 people shows a mild positive correlation between the proportion of Latvians and poverty level in the United States with a correlation coefficient (R) of 0.396 and weighted average of 10.5%, a difference of 35.2%.
Poverty Correlation Summary
| Measurement | Spanish American Indian | Latvian |
| Minimum | 7.3% | 1.8% |
| Maximum | 48.0% | 52.6% |
| Range | 40.7% | 50.7% |
| Mean | 16.0% | 9.9% |
| Median | 13.8% | 8.8% |
| Interquartile 25% (IQ1) | 11.3% | 6.1% |
| Interquartile 75% (IQ3) | 17.2% | 12.5% |
| Interquartile Range (IQR) | 5.9% | 6.4% |
| Standard Deviation (Sample) | 8.1% | 7.3% |
| Standard Deviation (Population) | 8.0% | 7.3% |
Similar Demographics by Poverty
Demographics Similar to Spanish American Indians by Poverty
In terms of poverty, the demographic groups most similar to Spanish American Indians are Immigrants from Trinidad and Tobago (14.2%, a difference of 0.10%), Immigrants from Burma/Myanmar (14.2%, a difference of 0.11%), Cree (14.2%, a difference of 0.20%), Immigrants from El Salvador (14.3%, a difference of 0.36%), and Immigrants from Ecuador (14.3%, a difference of 0.45%).
| Demographics | Rating | Rank | Poverty |
| Immigrants | Sudan | 0.3 /100 | #245 | Tragic 14.1% |
| Potawatomi | 0.3 /100 | #246 | Tragic 14.1% |
| Liberians | 0.2 /100 | #247 | Tragic 14.1% |
| Immigrants | Western Africa | 0.2 /100 | #248 | Tragic 14.1% |
| Immigrants | Ghana | 0.2 /100 | #249 | Tragic 14.2% |
| Cree | 0.2 /100 | #250 | Tragic 14.2% |
| Immigrants | Burma/Myanmar | 0.2 /100 | #251 | Tragic 14.2% |
| Spanish American Indians | 0.2 /100 | #252 | Tragic 14.2% |
| Immigrants | Trinidad and Tobago | 0.2 /100 | #253 | Tragic 14.2% |
| Immigrants | El Salvador | 0.1 /100 | #254 | Tragic 14.3% |
| Immigrants | Ecuador | 0.1 /100 | #255 | Tragic 14.3% |
| Mexican American Indians | 0.1 /100 | #256 | Tragic 14.3% |
| Trinidadians and Tobagonians | 0.1 /100 | #257 | Tragic 14.3% |
| Ottawa | 0.1 /100 | #258 | Tragic 14.3% |
| Immigrants | Nicaragua | 0.1 /100 | #259 | Tragic 14.3% |
Demographics Similar to Latvians by Poverty
In terms of poverty, the demographic groups most similar to Latvians are Norwegian (10.5%, a difference of 0.10%), Immigrants from Scotland (10.6%, a difference of 0.39%), Lithuanian (10.5%, a difference of 0.46%), Immigrants from North Macedonia (10.6%, a difference of 0.51%), and Luxembourger (10.6%, a difference of 0.58%).
| Demographics | Rating | Rank | Poverty |
| Immigrants | Lithuania | 99.9 /100 | #11 | Exceptional 10.3% |
| Bhutanese | 99.8 /100 | #12 | Exceptional 10.4% |
| Immigrants | Hong Kong | 99.8 /100 | #13 | Exceptional 10.4% |
| Immigrants | Bolivia | 99.8 /100 | #14 | Exceptional 10.4% |
| Bolivians | 99.8 /100 | #15 | Exceptional 10.4% |
| Lithuanians | 99.8 /100 | #16 | Exceptional 10.5% |
| Norwegians | 99.8 /100 | #17 | Exceptional 10.5% |
| Latvians | 99.8 /100 | #18 | Exceptional 10.5% |
| Immigrants | Scotland | 99.7 /100 | #19 | Exceptional 10.6% |
| Immigrants | North Macedonia | 99.7 /100 | #20 | Exceptional 10.6% |
| Luxembourgers | 99.7 /100 | #21 | Exceptional 10.6% |
| Eastern Europeans | 99.7 /100 | #22 | Exceptional 10.6% |
| Swedes | 99.7 /100 | #23 | Exceptional 10.6% |
| Italians | 99.7 /100 | #24 | Exceptional 10.6% |
| Croatians | 99.6 /100 | #25 | Exceptional 10.6% |