Spanish American Indian vs Belgian Poverty
COMPARE
Spanish American Indian
Belgian
Poverty
Poverty Comparison
Spanish American Indians
Belgians
14.2%
POVERTY
0.2/ 100
METRIC RATING
252nd/ 347
METRIC RANK
11.4%
POVERTY
95.8/ 100
METRIC RATING
88th/ 347
METRIC RANK
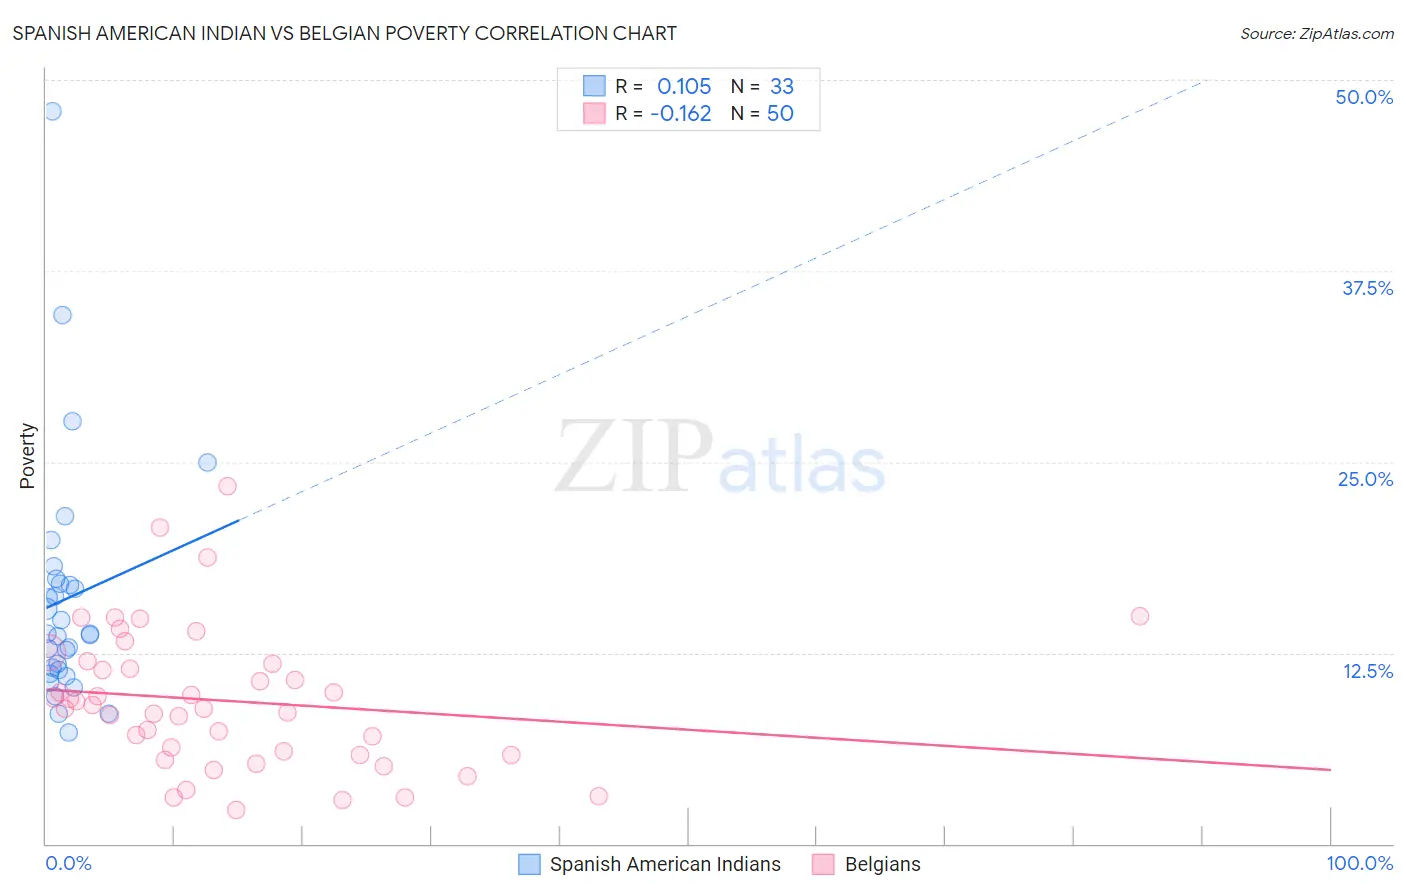
Spanish American Indian vs Belgian Poverty Correlation Chart
The statistical analysis conducted on geographies consisting of 73,142,105 people shows a poor positive correlation between the proportion of Spanish American Indians and poverty level in the United States with a correlation coefficient (R) of 0.105 and weighted average of 14.2%. Similarly, the statistical analysis conducted on geographies consisting of 355,864,059 people shows a poor negative correlation between the proportion of Belgians and poverty level in the United States with a correlation coefficient (R) of -0.162 and weighted average of 11.4%, a difference of 25.0%.
Poverty Correlation Summary
| Measurement | Spanish American Indian | Belgian |
| Minimum | 7.3% | 2.2% |
| Maximum | 48.0% | 23.4% |
| Range | 40.7% | 21.2% |
| Mean | 16.0% | 9.4% |
| Median | 13.8% | 9.0% |
| Interquartile 25% (IQ1) | 11.3% | 5.8% |
| Interquartile 75% (IQ3) | 17.2% | 11.8% |
| Interquartile Range (IQR) | 5.9% | 5.9% |
| Standard Deviation (Sample) | 8.1% | 4.6% |
| Standard Deviation (Population) | 8.0% | 4.5% |
Similar Demographics by Poverty
Demographics Similar to Spanish American Indians by Poverty
In terms of poverty, the demographic groups most similar to Spanish American Indians are Immigrants from Trinidad and Tobago (14.2%, a difference of 0.10%), Immigrants from Burma/Myanmar (14.2%, a difference of 0.11%), Cree (14.2%, a difference of 0.20%), Immigrants from El Salvador (14.3%, a difference of 0.36%), and Immigrants from Ecuador (14.3%, a difference of 0.45%).
| Demographics | Rating | Rank | Poverty |
| Immigrants | Sudan | 0.3 /100 | #245 | Tragic 14.1% |
| Potawatomi | 0.3 /100 | #246 | Tragic 14.1% |
| Liberians | 0.2 /100 | #247 | Tragic 14.1% |
| Immigrants | Western Africa | 0.2 /100 | #248 | Tragic 14.1% |
| Immigrants | Ghana | 0.2 /100 | #249 | Tragic 14.2% |
| Cree | 0.2 /100 | #250 | Tragic 14.2% |
| Immigrants | Burma/Myanmar | 0.2 /100 | #251 | Tragic 14.2% |
| Spanish American Indians | 0.2 /100 | #252 | Tragic 14.2% |
| Immigrants | Trinidad and Tobago | 0.2 /100 | #253 | Tragic 14.2% |
| Immigrants | El Salvador | 0.1 /100 | #254 | Tragic 14.3% |
| Immigrants | Ecuador | 0.1 /100 | #255 | Tragic 14.3% |
| Mexican American Indians | 0.1 /100 | #256 | Tragic 14.3% |
| Trinidadians and Tobagonians | 0.1 /100 | #257 | Tragic 14.3% |
| Ottawa | 0.1 /100 | #258 | Tragic 14.3% |
| Immigrants | Nicaragua | 0.1 /100 | #259 | Tragic 14.3% |
Demographics Similar to Belgians by Poverty
In terms of poverty, the demographic groups most similar to Belgians are Czechoslovakian (11.4%, a difference of 0.040%), Jordanian (11.4%, a difference of 0.14%), Northern European (11.4%, a difference of 0.14%), Immigrants from Denmark (11.4%, a difference of 0.20%), and Immigrants from England (11.4%, a difference of 0.26%).
| Demographics | Rating | Rank | Poverty |
| Irish | 96.6 /100 | #81 | Exceptional 11.3% |
| Egyptians | 96.5 /100 | #82 | Exceptional 11.3% |
| Immigrants | Sweden | 96.3 /100 | #83 | Exceptional 11.3% |
| English | 96.3 /100 | #84 | Exceptional 11.3% |
| Immigrants | England | 96.2 /100 | #85 | Exceptional 11.4% |
| Jordanians | 96.0 /100 | #86 | Exceptional 11.4% |
| Northern Europeans | 96.0 /100 | #87 | Exceptional 11.4% |
| Belgians | 95.8 /100 | #88 | Exceptional 11.4% |
| Czechoslovakians | 95.7 /100 | #89 | Exceptional 11.4% |
| Immigrants | Denmark | 95.5 /100 | #90 | Exceptional 11.4% |
| Finns | 95.2 /100 | #91 | Exceptional 11.4% |
| British | 95.0 /100 | #92 | Exceptional 11.4% |
| Romanians | 94.9 /100 | #93 | Exceptional 11.4% |
| Paraguayans | 94.9 /100 | #94 | Exceptional 11.4% |
| Australians | 94.9 /100 | #95 | Exceptional 11.4% |