Immigrants from Liberia vs Immigrants from South Central Asia Poverty
COMPARE
Immigrants from Liberia
Immigrants from South Central Asia
Poverty
Poverty Comparison
Immigrants from Liberia
Immigrants from South Central Asia
14.4%
POVERTY
0.1/ 100
METRIC RATING
262nd/ 347
METRIC RANK
10.2%
POVERTY
99.9/ 100
METRIC RATING
9th/ 347
METRIC RANK
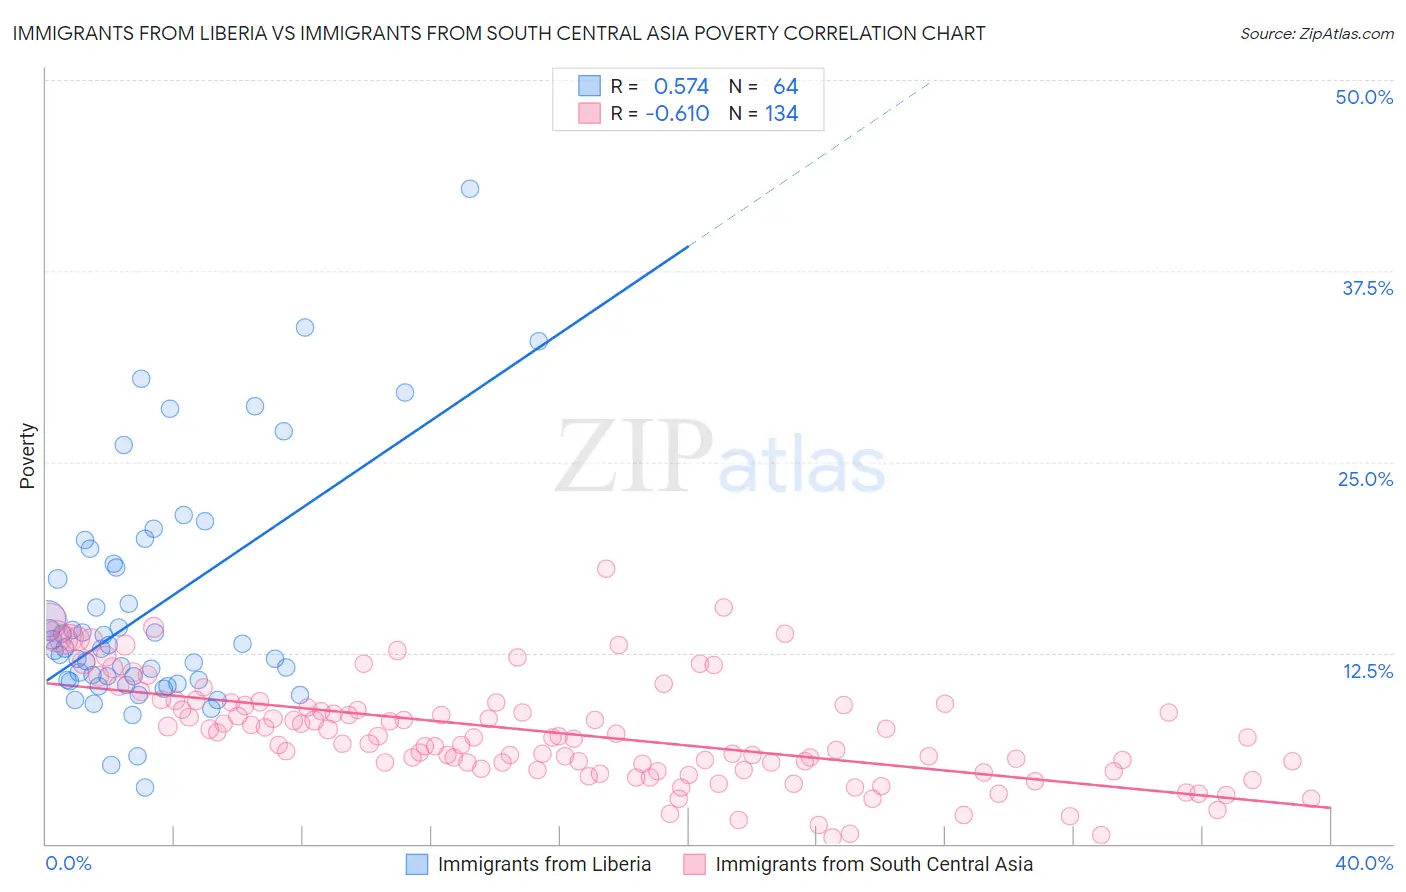
Immigrants from Liberia vs Immigrants from South Central Asia Poverty Correlation Chart
The statistical analysis conducted on geographies consisting of 135,251,059 people shows a substantial positive correlation between the proportion of Immigrants from Liberia and poverty level in the United States with a correlation coefficient (R) of 0.574 and weighted average of 14.4%. Similarly, the statistical analysis conducted on geographies consisting of 472,664,539 people shows a significant negative correlation between the proportion of Immigrants from South Central Asia and poverty level in the United States with a correlation coefficient (R) of -0.610 and weighted average of 10.2%, a difference of 40.9%.
Poverty Correlation Summary
| Measurement | Immigrants from Liberia | Immigrants from South Central Asia |
| Minimum | 3.7% | 0.44% |
| Maximum | 42.9% | 18.0% |
| Range | 39.2% | 17.6% |
| Mean | 15.3% | 7.3% |
| Median | 12.8% | 7.0% |
| Interquartile 25% (IQ1) | 10.7% | 4.9% |
| Interquartile 75% (IQ3) | 18.2% | 9.2% |
| Interquartile Range (IQR) | 7.5% | 4.2% |
| Standard Deviation (Sample) | 7.6% | 3.4% |
| Standard Deviation (Population) | 7.5% | 3.4% |
Similar Demographics by Poverty
Demographics Similar to Immigrants from Liberia by Poverty
In terms of poverty, the demographic groups most similar to Immigrants from Liberia are Cherokee (14.4%, a difference of 0.16%), Cape Verdean (14.4%, a difference of 0.18%), Immigrants from Nicaragua (14.3%, a difference of 0.26%), Jamaican (14.4%, a difference of 0.35%), and Immigrants from Jamaica (14.4%, a difference of 0.43%).
| Demographics | Rating | Rank | Poverty |
| Immigrants | Ecuador | 0.1 /100 | #255 | Tragic 14.3% |
| Mexican American Indians | 0.1 /100 | #256 | Tragic 14.3% |
| Trinidadians and Tobagonians | 0.1 /100 | #257 | Tragic 14.3% |
| Ottawa | 0.1 /100 | #258 | Tragic 14.3% |
| Immigrants | Nicaragua | 0.1 /100 | #259 | Tragic 14.3% |
| Cape Verdeans | 0.1 /100 | #260 | Tragic 14.4% |
| Cherokee | 0.1 /100 | #261 | Tragic 14.4% |
| Immigrants | Liberia | 0.1 /100 | #262 | Tragic 14.4% |
| Jamaicans | 0.1 /100 | #263 | Tragic 14.4% |
| Immigrants | Jamaica | 0.1 /100 | #264 | Tragic 14.4% |
| Immigrants | Guyana | 0.1 /100 | #265 | Tragic 14.5% |
| Guyanese | 0.1 /100 | #266 | Tragic 14.5% |
| Iroquois | 0.1 /100 | #267 | Tragic 14.5% |
| Sub-Saharan Africans | 0.1 /100 | #268 | Tragic 14.5% |
| Immigrants | Cuba | 0.1 /100 | #269 | Tragic 14.6% |
Demographics Similar to Immigrants from South Central Asia by Poverty
In terms of poverty, the demographic groups most similar to Immigrants from South Central Asia are Bulgarian (10.2%, a difference of 0.41%), Maltese (10.2%, a difference of 0.45%), Filipino (10.1%, a difference of 0.87%), Assyrian/Chaldean/Syriac (10.1%, a difference of 1.0%), and Immigrants from Ireland (10.1%, a difference of 1.2%).
| Demographics | Rating | Rank | Poverty |
| Chinese | 100.0 /100 | #2 | Exceptional 9.5% |
| Thais | 100.0 /100 | #3 | Exceptional 9.6% |
| Immigrants | Taiwan | 100.0 /100 | #4 | Exceptional 9.7% |
| Immigrants | Ireland | 99.9 /100 | #5 | Exceptional 10.1% |
| Assyrians/Chaldeans/Syriacs | 99.9 /100 | #6 | Exceptional 10.1% |
| Filipinos | 99.9 /100 | #7 | Exceptional 10.1% |
| Maltese | 99.9 /100 | #8 | Exceptional 10.2% |
| Immigrants | South Central Asia | 99.9 /100 | #9 | Exceptional 10.2% |
| Bulgarians | 99.9 /100 | #10 | Exceptional 10.2% |
| Immigrants | Lithuania | 99.9 /100 | #11 | Exceptional 10.3% |
| Bhutanese | 99.8 /100 | #12 | Exceptional 10.4% |
| Immigrants | Hong Kong | 99.8 /100 | #13 | Exceptional 10.4% |
| Immigrants | Bolivia | 99.8 /100 | #14 | Exceptional 10.4% |
| Bolivians | 99.8 /100 | #15 | Exceptional 10.4% |
| Lithuanians | 99.8 /100 | #16 | Exceptional 10.5% |