Spanish American Indian vs Colville Poverty
COMPARE
Spanish American Indian
Colville
Poverty
Poverty Comparison
Spanish American Indians
Colville
14.2%
POVERTY
0.2/ 100
METRIC RATING
252nd/ 347
METRIC RANK
16.6%
POVERTY
0.0/ 100
METRIC RATING
323rd/ 347
METRIC RANK
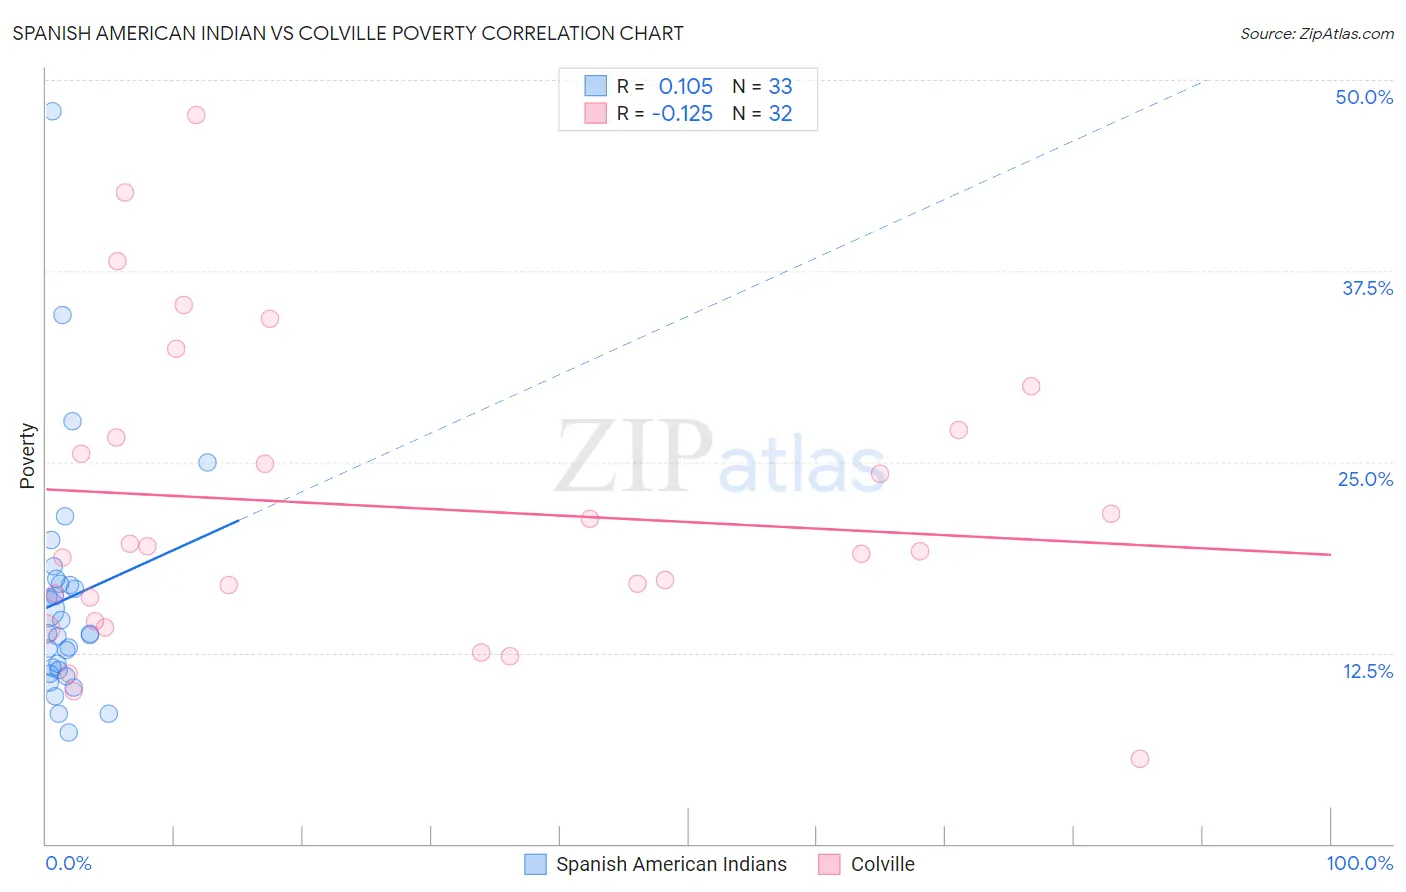
Spanish American Indian vs Colville Poverty Correlation Chart
The statistical analysis conducted on geographies consisting of 73,142,105 people shows a poor positive correlation between the proportion of Spanish American Indians and poverty level in the United States with a correlation coefficient (R) of 0.105 and weighted average of 14.2%. Similarly, the statistical analysis conducted on geographies consisting of 34,683,494 people shows a poor negative correlation between the proportion of Colville and poverty level in the United States with a correlation coefficient (R) of -0.125 and weighted average of 16.6%, a difference of 16.5%.
Poverty Correlation Summary
| Measurement | Spanish American Indian | Colville |
| Minimum | 7.3% | 5.6% |
| Maximum | 48.0% | 47.7% |
| Range | 40.7% | 42.2% |
| Mean | 16.0% | 22.1% |
| Median | 13.8% | 19.3% |
| Interquartile 25% (IQ1) | 11.3% | 15.3% |
| Interquartile 75% (IQ3) | 17.2% | 26.9% |
| Interquartile Range (IQR) | 5.9% | 11.5% |
| Standard Deviation (Sample) | 8.1% | 9.8% |
| Standard Deviation (Population) | 8.0% | 9.7% |
Similar Demographics by Poverty
Demographics Similar to Spanish American Indians by Poverty
In terms of poverty, the demographic groups most similar to Spanish American Indians are Immigrants from Trinidad and Tobago (14.2%, a difference of 0.10%), Immigrants from Burma/Myanmar (14.2%, a difference of 0.11%), Cree (14.2%, a difference of 0.20%), Immigrants from El Salvador (14.3%, a difference of 0.36%), and Immigrants from Ecuador (14.3%, a difference of 0.45%).
| Demographics | Rating | Rank | Poverty |
| Immigrants | Sudan | 0.3 /100 | #245 | Tragic 14.1% |
| Potawatomi | 0.3 /100 | #246 | Tragic 14.1% |
| Liberians | 0.2 /100 | #247 | Tragic 14.1% |
| Immigrants | Western Africa | 0.2 /100 | #248 | Tragic 14.1% |
| Immigrants | Ghana | 0.2 /100 | #249 | Tragic 14.2% |
| Cree | 0.2 /100 | #250 | Tragic 14.2% |
| Immigrants | Burma/Myanmar | 0.2 /100 | #251 | Tragic 14.2% |
| Spanish American Indians | 0.2 /100 | #252 | Tragic 14.2% |
| Immigrants | Trinidad and Tobago | 0.2 /100 | #253 | Tragic 14.2% |
| Immigrants | El Salvador | 0.1 /100 | #254 | Tragic 14.3% |
| Immigrants | Ecuador | 0.1 /100 | #255 | Tragic 14.3% |
| Mexican American Indians | 0.1 /100 | #256 | Tragic 14.3% |
| Trinidadians and Tobagonians | 0.1 /100 | #257 | Tragic 14.3% |
| Ottawa | 0.1 /100 | #258 | Tragic 14.3% |
| Immigrants | Nicaragua | 0.1 /100 | #259 | Tragic 14.3% |
Demographics Similar to Colville by Poverty
In terms of poverty, the demographic groups most similar to Colville are Yakama (16.7%, a difference of 0.54%), Menominee (16.4%, a difference of 0.75%), Central American Indian (16.7%, a difference of 0.77%), Paiute (16.7%, a difference of 1.1%), and Kiowa (16.8%, a difference of 1.6%).
| Demographics | Rating | Rank | Poverty |
| Hondurans | 0.0 /100 | #316 | Tragic 15.9% |
| U.S. Virgin Islanders | 0.0 /100 | #317 | Tragic 16.1% |
| Immigrants | Dominica | 0.0 /100 | #318 | Tragic 16.1% |
| Immigrants | Congo | 0.0 /100 | #319 | Tragic 16.1% |
| Immigrants | Honduras | 0.0 /100 | #320 | Tragic 16.2% |
| Arapaho | 0.0 /100 | #321 | Tragic 16.3% |
| Menominee | 0.0 /100 | #322 | Tragic 16.4% |
| Colville | 0.0 /100 | #323 | Tragic 16.6% |
| Yakama | 0.0 /100 | #324 | Tragic 16.7% |
| Central American Indians | 0.0 /100 | #325 | Tragic 16.7% |
| Paiute | 0.0 /100 | #326 | Tragic 16.7% |
| Kiowa | 0.0 /100 | #327 | Tragic 16.8% |
| Ute | 0.0 /100 | #328 | Tragic 16.9% |
| Blacks/African Americans | 0.0 /100 | #329 | Tragic 17.3% |
| Dominicans | 0.0 /100 | #330 | Tragic 17.6% |