Spanish American Indian vs Immigrants from North America Poverty
COMPARE
Spanish American Indian
Immigrants from North America
Poverty
Poverty Comparison
Spanish American Indians
Immigrants from North America
14.2%
POVERTY
0.2/ 100
METRIC RATING
252nd/ 347
METRIC RANK
11.3%
POVERTY
96.8/ 100
METRIC RATING
76th/ 347
METRIC RANK
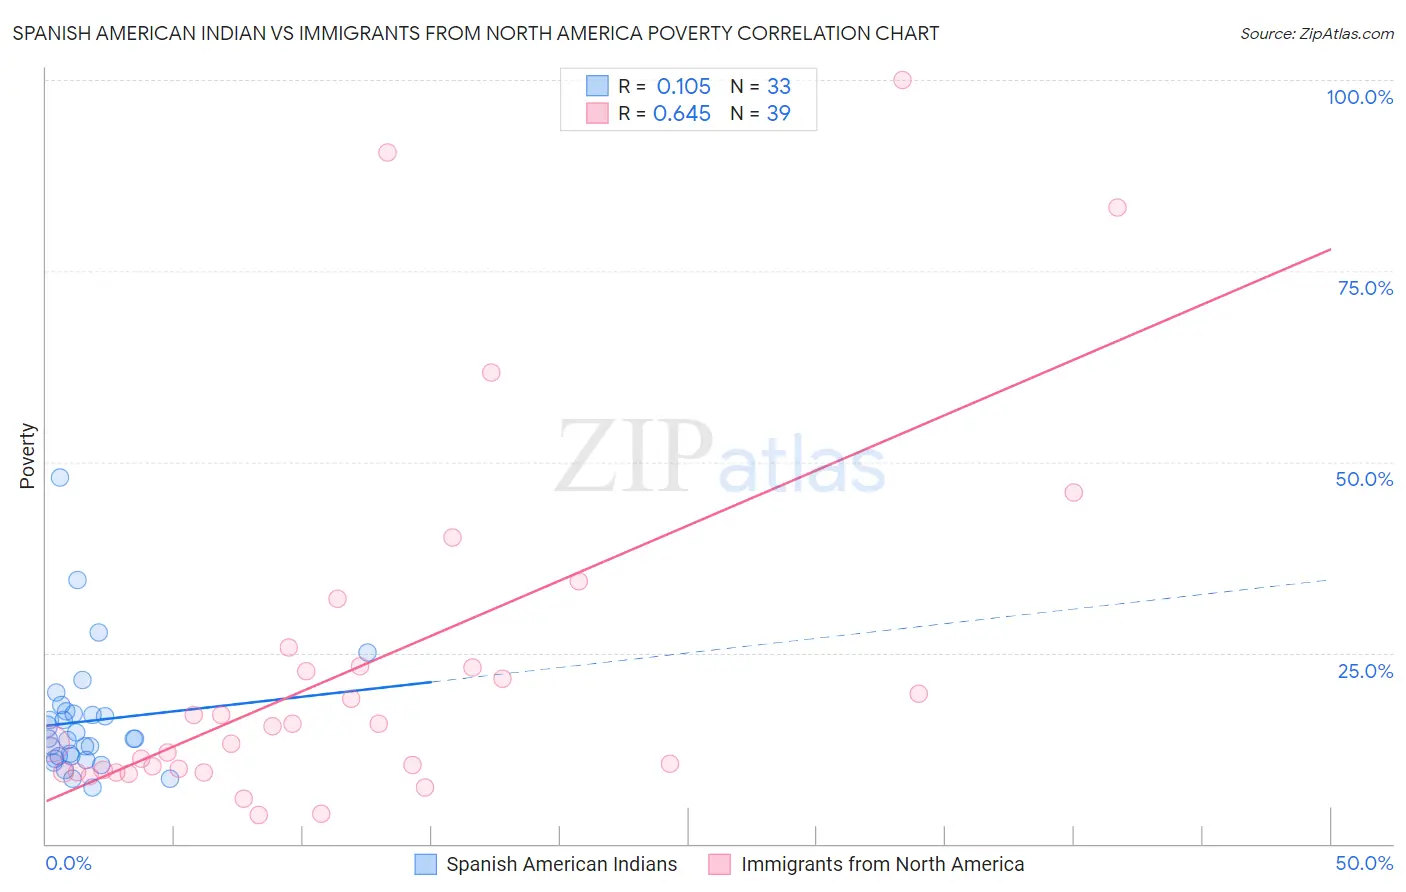
Spanish American Indian vs Immigrants from North America Poverty Correlation Chart
The statistical analysis conducted on geographies consisting of 73,142,105 people shows a poor positive correlation between the proportion of Spanish American Indians and poverty level in the United States with a correlation coefficient (R) of 0.105 and weighted average of 14.2%. Similarly, the statistical analysis conducted on geographies consisting of 462,172,327 people shows a significant positive correlation between the proportion of Immigrants from North America and poverty level in the United States with a correlation coefficient (R) of 0.645 and weighted average of 11.3%, a difference of 25.9%.
Poverty Correlation Summary
| Measurement | Spanish American Indian | Immigrants from North America |
| Minimum | 7.3% | 3.8% |
| Maximum | 48.0% | 100.0% |
| Range | 40.7% | 96.2% |
| Mean | 16.0% | 23.1% |
| Median | 13.8% | 15.4% |
| Interquartile 25% (IQ1) | 11.3% | 9.4% |
| Interquartile 75% (IQ3) | 17.2% | 23.2% |
| Interquartile Range (IQR) | 5.9% | 13.8% |
| Standard Deviation (Sample) | 8.1% | 23.3% |
| Standard Deviation (Population) | 8.0% | 23.0% |
Similar Demographics by Poverty
Demographics Similar to Spanish American Indians by Poverty
In terms of poverty, the demographic groups most similar to Spanish American Indians are Immigrants from Trinidad and Tobago (14.2%, a difference of 0.10%), Immigrants from Burma/Myanmar (14.2%, a difference of 0.11%), Cree (14.2%, a difference of 0.20%), Immigrants from El Salvador (14.3%, a difference of 0.36%), and Immigrants from Ecuador (14.3%, a difference of 0.45%).
| Demographics | Rating | Rank | Poverty |
| Immigrants | Sudan | 0.3 /100 | #245 | Tragic 14.1% |
| Potawatomi | 0.3 /100 | #246 | Tragic 14.1% |
| Liberians | 0.2 /100 | #247 | Tragic 14.1% |
| Immigrants | Western Africa | 0.2 /100 | #248 | Tragic 14.1% |
| Immigrants | Ghana | 0.2 /100 | #249 | Tragic 14.2% |
| Cree | 0.2 /100 | #250 | Tragic 14.2% |
| Immigrants | Burma/Myanmar | 0.2 /100 | #251 | Tragic 14.2% |
| Spanish American Indians | 0.2 /100 | #252 | Tragic 14.2% |
| Immigrants | Trinidad and Tobago | 0.2 /100 | #253 | Tragic 14.2% |
| Immigrants | El Salvador | 0.1 /100 | #254 | Tragic 14.3% |
| Immigrants | Ecuador | 0.1 /100 | #255 | Tragic 14.3% |
| Mexican American Indians | 0.1 /100 | #256 | Tragic 14.3% |
| Trinidadians and Tobagonians | 0.1 /100 | #257 | Tragic 14.3% |
| Ottawa | 0.1 /100 | #258 | Tragic 14.3% |
| Immigrants | Nicaragua | 0.1 /100 | #259 | Tragic 14.3% |
Demographics Similar to Immigrants from North America by Poverty
In terms of poverty, the demographic groups most similar to Immigrants from North America are Immigrants from Eastern Asia (11.3%, a difference of 0.070%), Dutch (11.3%, a difference of 0.080%), Cambodian (11.3%, a difference of 0.13%), Indian (Asian) (11.3%, a difference of 0.14%), and Immigrants from Eastern Europe (11.3%, a difference of 0.15%).
| Demographics | Rating | Rank | Poverty |
| Serbians | 97.4 /100 | #69 | Exceptional 11.2% |
| Immigrants | Canada | 97.3 /100 | #70 | Exceptional 11.3% |
| Zimbabweans | 97.3 /100 | #71 | Exceptional 11.3% |
| Europeans | 97.2 /100 | #72 | Exceptional 11.3% |
| Immigrants | Belgium | 97.2 /100 | #73 | Exceptional 11.3% |
| Carpatho Rusyns | 97.2 /100 | #74 | Exceptional 11.3% |
| Immigrants | Eastern Europe | 97.0 /100 | #75 | Exceptional 11.3% |
| Immigrants | North America | 96.8 /100 | #76 | Exceptional 11.3% |
| Immigrants | Eastern Asia | 96.7 /100 | #77 | Exceptional 11.3% |
| Dutch | 96.7 /100 | #78 | Exceptional 11.3% |
| Cambodians | 96.7 /100 | #79 | Exceptional 11.3% |
| Indians (Asian) | 96.6 /100 | #80 | Exceptional 11.3% |
| Irish | 96.6 /100 | #81 | Exceptional 11.3% |
| Egyptians | 96.5 /100 | #82 | Exceptional 11.3% |
| Immigrants | Sweden | 96.3 /100 | #83 | Exceptional 11.3% |