Comanche vs Immigrants from South Central Asia Poverty
COMPARE
Comanche
Immigrants from South Central Asia
Poverty
Poverty Comparison
Comanche
Immigrants from South Central Asia
15.0%
POVERTY
0.0/ 100
METRIC RATING
282nd/ 347
METRIC RANK
10.2%
POVERTY
99.9/ 100
METRIC RATING
9th/ 347
METRIC RANK
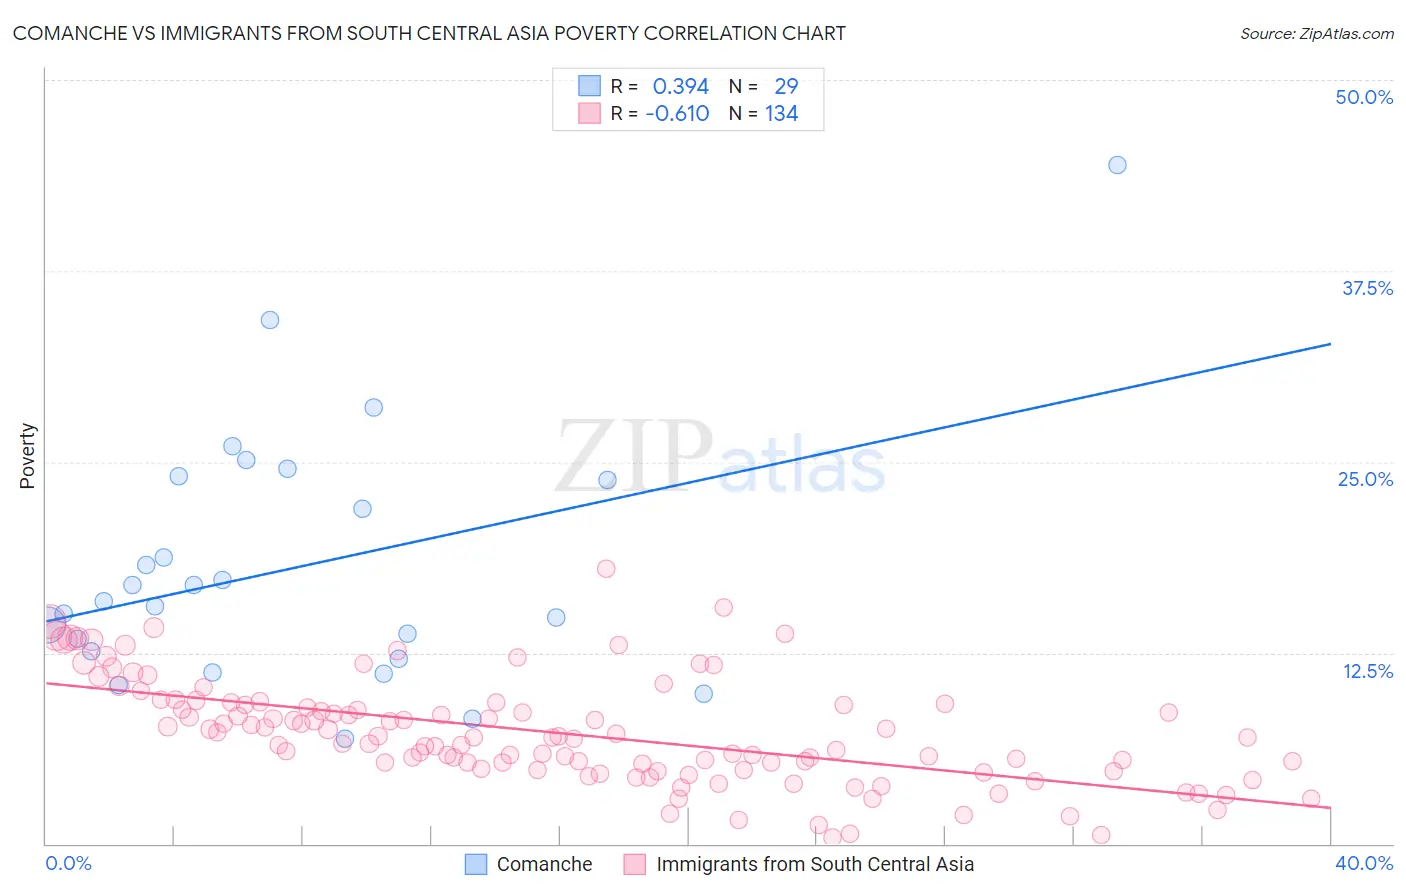
Comanche vs Immigrants from South Central Asia Poverty Correlation Chart
The statistical analysis conducted on geographies consisting of 109,758,867 people shows a mild positive correlation between the proportion of Comanche and poverty level in the United States with a correlation coefficient (R) of 0.394 and weighted average of 15.0%. Similarly, the statistical analysis conducted on geographies consisting of 472,664,539 people shows a significant negative correlation between the proportion of Immigrants from South Central Asia and poverty level in the United States with a correlation coefficient (R) of -0.610 and weighted average of 10.2%, a difference of 46.6%.
Poverty Correlation Summary
| Measurement | Comanche | Immigrants from South Central Asia |
| Minimum | 6.8% | 0.44% |
| Maximum | 44.4% | 18.0% |
| Range | 37.6% | 17.6% |
| Mean | 18.1% | 7.3% |
| Median | 15.9% | 7.0% |
| Interquartile 25% (IQ1) | 12.4% | 4.9% |
| Interquartile 75% (IQ3) | 24.0% | 9.2% |
| Interquartile Range (IQR) | 11.6% | 4.2% |
| Standard Deviation (Sample) | 8.3% | 3.4% |
| Standard Deviation (Population) | 8.1% | 3.4% |
Similar Demographics by Poverty
Demographics Similar to Comanche by Poverty
In terms of poverty, the demographic groups most similar to Comanche are Immigrants from Haiti (15.0%, a difference of 0.12%), West Indian (15.0%, a difference of 0.23%), Vietnamese (15.0%, a difference of 0.28%), Immigrants from Barbados (14.9%, a difference of 0.33%), and Haitian (14.9%, a difference of 0.40%).
| Demographics | Rating | Rank | Poverty |
| Immigrants | West Indies | 0.0 /100 | #275 | Tragic 14.8% |
| Immigrants | Bahamas | 0.0 /100 | #276 | Tragic 14.8% |
| Bangladeshis | 0.0 /100 | #277 | Tragic 14.8% |
| Belizeans | 0.0 /100 | #278 | Tragic 14.8% |
| Immigrants | St. Vincent and the Grenadines | 0.0 /100 | #279 | Tragic 14.9% |
| Haitians | 0.0 /100 | #280 | Tragic 14.9% |
| Immigrants | Barbados | 0.0 /100 | #281 | Tragic 14.9% |
| Comanche | 0.0 /100 | #282 | Tragic 15.0% |
| Immigrants | Haiti | 0.0 /100 | #283 | Tragic 15.0% |
| West Indians | 0.0 /100 | #284 | Tragic 15.0% |
| Vietnamese | 0.0 /100 | #285 | Tragic 15.0% |
| Immigrants | Latin America | 0.0 /100 | #286 | Tragic 15.0% |
| Inupiat | 0.0 /100 | #287 | Tragic 15.1% |
| Yaqui | 0.0 /100 | #288 | Tragic 15.1% |
| Immigrants | Belize | 0.0 /100 | #289 | Tragic 15.1% |
Demographics Similar to Immigrants from South Central Asia by Poverty
In terms of poverty, the demographic groups most similar to Immigrants from South Central Asia are Bulgarian (10.2%, a difference of 0.41%), Maltese (10.2%, a difference of 0.45%), Filipino (10.1%, a difference of 0.87%), Assyrian/Chaldean/Syriac (10.1%, a difference of 1.0%), and Immigrants from Ireland (10.1%, a difference of 1.2%).
| Demographics | Rating | Rank | Poverty |
| Chinese | 100.0 /100 | #2 | Exceptional 9.5% |
| Thais | 100.0 /100 | #3 | Exceptional 9.6% |
| Immigrants | Taiwan | 100.0 /100 | #4 | Exceptional 9.7% |
| Immigrants | Ireland | 99.9 /100 | #5 | Exceptional 10.1% |
| Assyrians/Chaldeans/Syriacs | 99.9 /100 | #6 | Exceptional 10.1% |
| Filipinos | 99.9 /100 | #7 | Exceptional 10.1% |
| Maltese | 99.9 /100 | #8 | Exceptional 10.2% |
| Immigrants | South Central Asia | 99.9 /100 | #9 | Exceptional 10.2% |
| Bulgarians | 99.9 /100 | #10 | Exceptional 10.2% |
| Immigrants | Lithuania | 99.9 /100 | #11 | Exceptional 10.3% |
| Bhutanese | 99.8 /100 | #12 | Exceptional 10.4% |
| Immigrants | Hong Kong | 99.8 /100 | #13 | Exceptional 10.4% |
| Immigrants | Bolivia | 99.8 /100 | #14 | Exceptional 10.4% |
| Bolivians | 99.8 /100 | #15 | Exceptional 10.4% |
| Lithuanians | 99.8 /100 | #16 | Exceptional 10.5% |