Soviet Union vs Peruvian Family Poverty
COMPARE
Soviet Union
Peruvian
Family Poverty
Family Poverty Comparison
Soviet Union
Peruvians
8.3%
FAMILY POVERTY
90.8/ 100
METRIC RATING
124th/ 347
METRIC RANK
8.8%
FAMILY POVERTY
68.0/ 100
METRIC RATING
159th/ 347
METRIC RANK
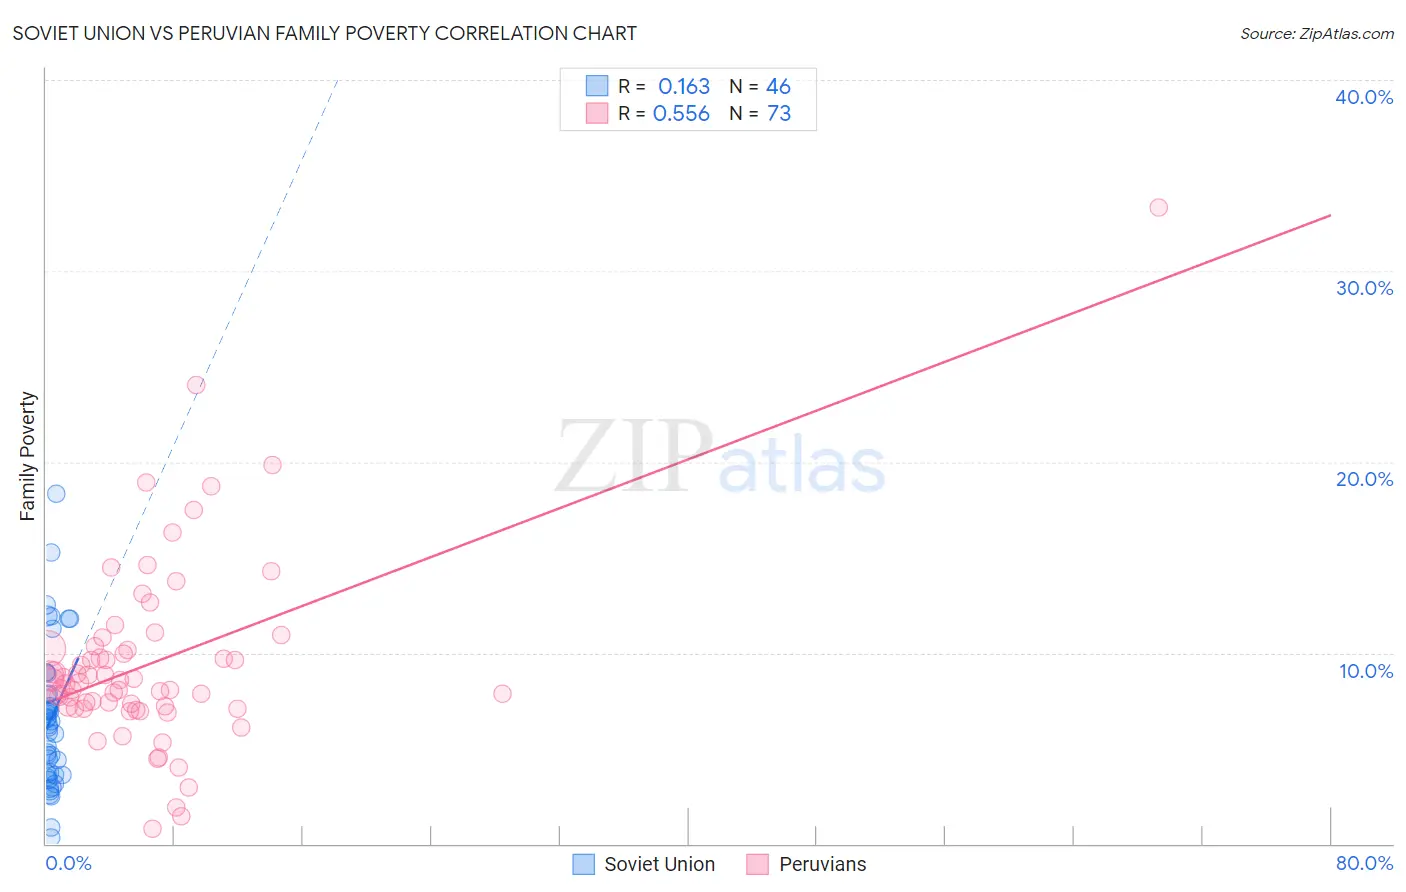
Soviet Union vs Peruvian Family Poverty Correlation Chart
The statistical analysis conducted on geographies consisting of 43,439,449 people shows a poor positive correlation between the proportion of Soviet Union and poverty level among families in the United States with a correlation coefficient (R) of 0.163 and weighted average of 8.3%. Similarly, the statistical analysis conducted on geographies consisting of 362,496,768 people shows a substantial positive correlation between the proportion of Peruvians and poverty level among families in the United States with a correlation coefficient (R) of 0.556 and weighted average of 8.8%, a difference of 5.4%.
Family Poverty Correlation Summary
| Measurement | Soviet Union | Peruvian |
| Minimum | 0.36% | 0.80% |
| Maximum | 18.3% | 33.3% |
| Range | 18.0% | 32.5% |
| Mean | 6.5% | 9.5% |
| Median | 6.2% | 8.5% |
| Interquartile 25% (IQ1) | 3.6% | 7.1% |
| Interquartile 75% (IQ3) | 7.9% | 10.3% |
| Interquartile Range (IQR) | 4.2% | 3.2% |
| Standard Deviation (Sample) | 3.8% | 5.0% |
| Standard Deviation (Population) | 3.7% | 4.9% |
Similar Demographics by Family Poverty
Demographics Similar to Soviet Union by Family Poverty
In terms of family poverty, the demographic groups most similar to Soviet Union are Pakistani (8.3%, a difference of 0.040%), Palestinian (8.3%, a difference of 0.10%), Paraguayan (8.3%, a difference of 0.17%), Native Hawaiian (8.3%, a difference of 0.18%), and Icelander (8.3%, a difference of 0.24%).
| Demographics | Rating | Rank | Family Poverty |
| Immigrants | Russia | 93.2 /100 | #117 | Exceptional 8.2% |
| Immigrants | Western Europe | 92.9 /100 | #118 | Exceptional 8.2% |
| French | 92.8 /100 | #119 | Exceptional 8.3% |
| Immigrants | Egypt | 91.6 /100 | #120 | Exceptional 8.3% |
| Native Hawaiians | 91.3 /100 | #121 | Exceptional 8.3% |
| Paraguayans | 91.2 /100 | #122 | Exceptional 8.3% |
| Palestinians | 91.1 /100 | #123 | Exceptional 8.3% |
| Soviet Union | 90.8 /100 | #124 | Exceptional 8.3% |
| Pakistanis | 90.8 /100 | #125 | Exceptional 8.3% |
| Icelanders | 90.3 /100 | #126 | Exceptional 8.3% |
| Immigrants | Hungary | 89.9 /100 | #127 | Excellent 8.4% |
| Argentineans | 89.6 /100 | #128 | Excellent 8.4% |
| Portuguese | 89.2 /100 | #129 | Excellent 8.4% |
| Immigrants | Bosnia and Herzegovina | 88.6 /100 | #130 | Excellent 8.4% |
| Puget Sound Salish | 88.6 /100 | #131 | Excellent 8.4% |
Demographics Similar to Peruvians by Family Poverty
In terms of family poverty, the demographic groups most similar to Peruvians are Hungarian (8.8%, a difference of 0.13%), White/Caucasian (8.8%, a difference of 0.16%), Immigrants from Northern Africa (8.8%, a difference of 0.17%), Tsimshian (8.8%, a difference of 0.20%), and Ethiopian (8.8%, a difference of 0.26%).
| Demographics | Rating | Rank | Family Poverty |
| Samoans | 79.8 /100 | #152 | Good 8.6% |
| Immigrants | Spain | 79.1 /100 | #153 | Good 8.6% |
| Immigrants | Vietnam | 75.4 /100 | #154 | Good 8.7% |
| Immigrants | Kuwait | 73.6 /100 | #155 | Good 8.7% |
| Immigrants | Oceania | 71.2 /100 | #156 | Good 8.7% |
| Tsimshian | 69.3 /100 | #157 | Good 8.8% |
| Whites/Caucasians | 69.1 /100 | #158 | Good 8.8% |
| Peruvians | 68.0 /100 | #159 | Good 8.8% |
| Hungarians | 67.2 /100 | #160 | Good 8.8% |
| Immigrants | Northern Africa | 66.9 /100 | #161 | Good 8.8% |
| Ethiopians | 66.3 /100 | #162 | Good 8.8% |
| Pennsylvania Germans | 66.0 /100 | #163 | Good 8.8% |
| Celtics | 64.9 /100 | #164 | Good 8.8% |
| Guamanians/Chamorros | 64.7 /100 | #165 | Good 8.8% |
| Afghans | 63.5 /100 | #166 | Good 8.8% |