Soviet Union vs Immigrants from Iran Family Poverty
COMPARE
Soviet Union
Immigrants from Iran
Family Poverty
Family Poverty Comparison
Soviet Union
Immigrants from Iran
8.3%
FAMILY POVERTY
90.8/ 100
METRIC RATING
124th/ 347
METRIC RANK
7.3%
FAMILY POVERTY
99.7/ 100
METRIC RATING
21st/ 347
METRIC RANK
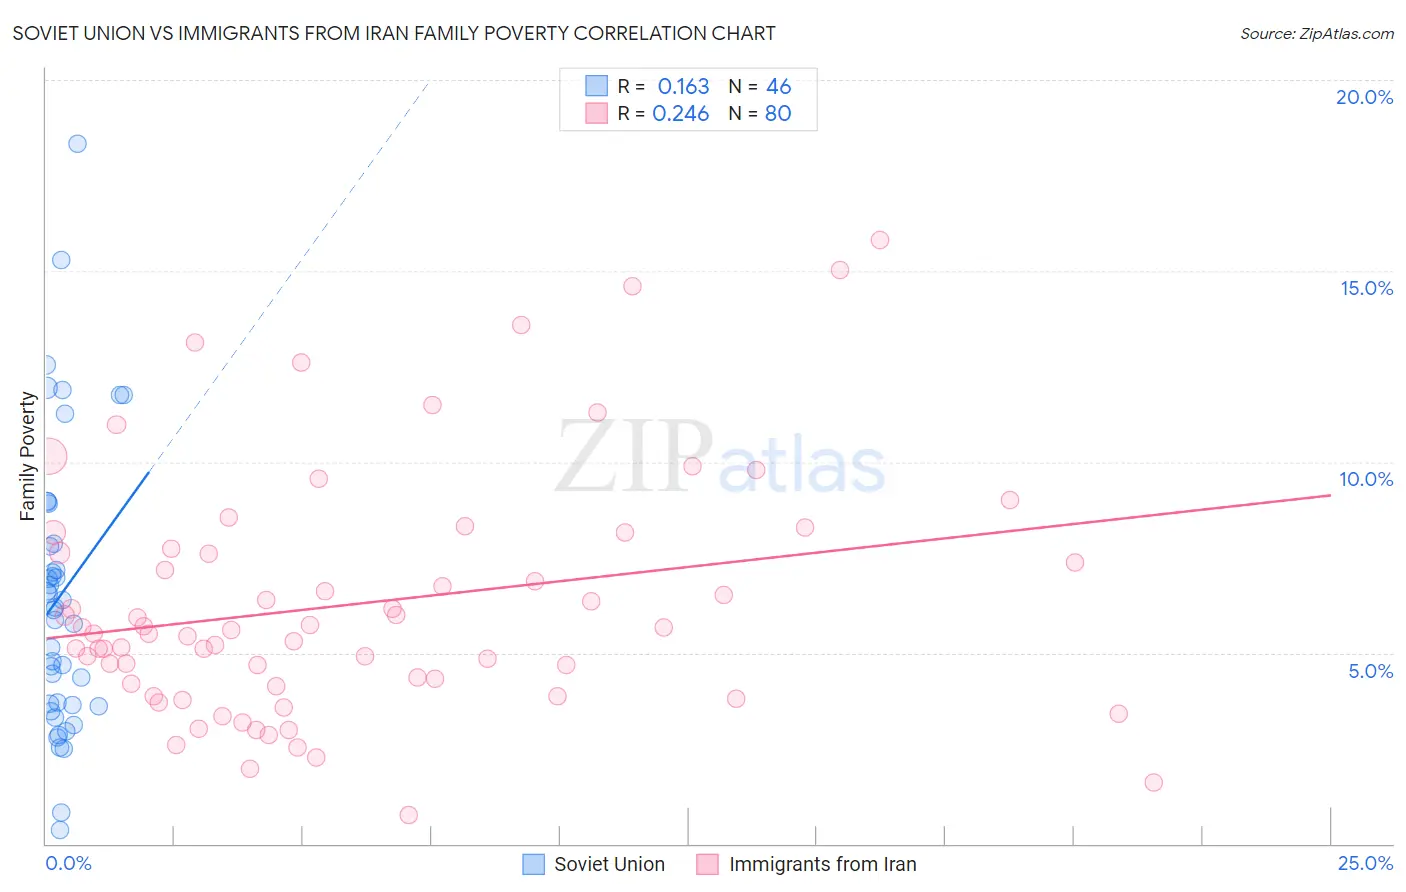
Soviet Union vs Immigrants from Iran Family Poverty Correlation Chart
The statistical analysis conducted on geographies consisting of 43,439,449 people shows a poor positive correlation between the proportion of Soviet Union and poverty level among families in the United States with a correlation coefficient (R) of 0.163 and weighted average of 8.3%. Similarly, the statistical analysis conducted on geographies consisting of 279,394,600 people shows a weak positive correlation between the proportion of Immigrants from Iran and poverty level among families in the United States with a correlation coefficient (R) of 0.246 and weighted average of 7.3%, a difference of 14.6%.
Family Poverty Correlation Summary
| Measurement | Soviet Union | Immigrants from Iran |
| Minimum | 0.36% | 0.76% |
| Maximum | 18.3% | 15.8% |
| Range | 18.0% | 15.0% |
| Mean | 6.5% | 6.3% |
| Median | 6.2% | 5.6% |
| Interquartile 25% (IQ1) | 3.6% | 4.2% |
| Interquartile 75% (IQ3) | 7.9% | 7.7% |
| Interquartile Range (IQR) | 4.2% | 3.5% |
| Standard Deviation (Sample) | 3.8% | 3.2% |
| Standard Deviation (Population) | 3.7% | 3.2% |
Similar Demographics by Family Poverty
Demographics Similar to Soviet Union by Family Poverty
In terms of family poverty, the demographic groups most similar to Soviet Union are Pakistani (8.3%, a difference of 0.040%), Palestinian (8.3%, a difference of 0.10%), Paraguayan (8.3%, a difference of 0.17%), Native Hawaiian (8.3%, a difference of 0.18%), and Icelander (8.3%, a difference of 0.24%).
| Demographics | Rating | Rank | Family Poverty |
| Immigrants | Russia | 93.2 /100 | #117 | Exceptional 8.2% |
| Immigrants | Western Europe | 92.9 /100 | #118 | Exceptional 8.2% |
| French | 92.8 /100 | #119 | Exceptional 8.3% |
| Immigrants | Egypt | 91.6 /100 | #120 | Exceptional 8.3% |
| Native Hawaiians | 91.3 /100 | #121 | Exceptional 8.3% |
| Paraguayans | 91.2 /100 | #122 | Exceptional 8.3% |
| Palestinians | 91.1 /100 | #123 | Exceptional 8.3% |
| Soviet Union | 90.8 /100 | #124 | Exceptional 8.3% |
| Pakistanis | 90.8 /100 | #125 | Exceptional 8.3% |
| Icelanders | 90.3 /100 | #126 | Exceptional 8.3% |
| Immigrants | Hungary | 89.9 /100 | #127 | Excellent 8.4% |
| Argentineans | 89.6 /100 | #128 | Excellent 8.4% |
| Portuguese | 89.2 /100 | #129 | Excellent 8.4% |
| Immigrants | Bosnia and Herzegovina | 88.6 /100 | #130 | Excellent 8.4% |
| Puget Sound Salish | 88.6 /100 | #131 | Excellent 8.4% |
Demographics Similar to Immigrants from Iran by Family Poverty
In terms of family poverty, the demographic groups most similar to Immigrants from Iran are Immigrants from Hong Kong (7.3%, a difference of 0.20%), Eastern European (7.2%, a difference of 0.36%), Danish (7.3%, a difference of 0.44%), Assyrian/Chaldean/Syriac (7.3%, a difference of 0.45%), and Immigrants from Lithuania (7.2%, a difference of 0.67%).
| Demographics | Rating | Rank | Family Poverty |
| Iranians | 99.8 /100 | #14 | Exceptional 7.1% |
| Lithuanians | 99.8 /100 | #15 | Exceptional 7.2% |
| Immigrants | South Central Asia | 99.8 /100 | #16 | Exceptional 7.2% |
| Luxembourgers | 99.8 /100 | #17 | Exceptional 7.2% |
| Immigrants | Lithuania | 99.8 /100 | #18 | Exceptional 7.2% |
| Eastern Europeans | 99.7 /100 | #19 | Exceptional 7.2% |
| Immigrants | Hong Kong | 99.7 /100 | #20 | Exceptional 7.3% |
| Immigrants | Iran | 99.7 /100 | #21 | Exceptional 7.3% |
| Danes | 99.7 /100 | #22 | Exceptional 7.3% |
| Assyrians/Chaldeans/Syriacs | 99.7 /100 | #23 | Exceptional 7.3% |
| Croatians | 99.7 /100 | #24 | Exceptional 7.3% |
| Burmese | 99.7 /100 | #25 | Exceptional 7.3% |
| Cypriots | 99.6 /100 | #26 | Exceptional 7.3% |
| Immigrants | Scotland | 99.6 /100 | #27 | Exceptional 7.3% |
| Immigrants | Korea | 99.6 /100 | #28 | Exceptional 7.4% |