Soviet Union vs Inupiat Family Poverty
COMPARE
Soviet Union
Inupiat
Family Poverty
Family Poverty Comparison
Soviet Union
Inupiat
8.3%
FAMILY POVERTY
90.8/ 100
METRIC RATING
124th/ 347
METRIC RANK
12.5%
FAMILY POVERTY
0.0/ 100
METRIC RATING
320th/ 347
METRIC RANK
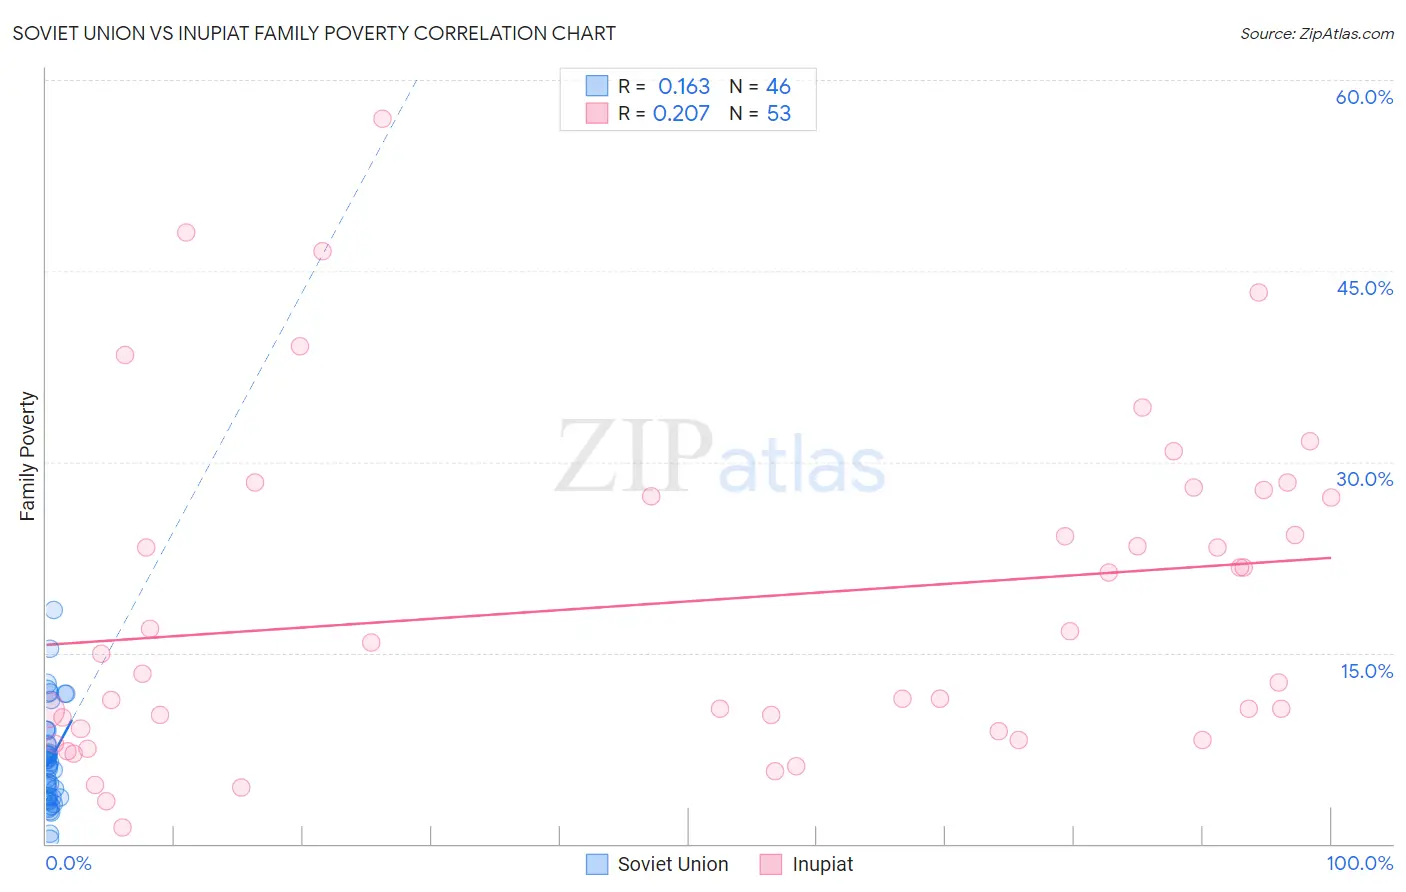
Soviet Union vs Inupiat Family Poverty Correlation Chart
The statistical analysis conducted on geographies consisting of 43,439,449 people shows a poor positive correlation between the proportion of Soviet Union and poverty level among families in the United States with a correlation coefficient (R) of 0.163 and weighted average of 8.3%. Similarly, the statistical analysis conducted on geographies consisting of 96,272,852 people shows a weak positive correlation between the proportion of Inupiat and poverty level among families in the United States with a correlation coefficient (R) of 0.207 and weighted average of 12.5%, a difference of 49.6%.
Family Poverty Correlation Summary
| Measurement | Soviet Union | Inupiat |
| Minimum | 0.36% | 1.3% |
| Maximum | 18.3% | 56.9% |
| Range | 18.0% | 55.6% |
| Mean | 6.5% | 19.0% |
| Median | 6.2% | 14.9% |
| Interquartile 25% (IQ1) | 3.6% | 8.9% |
| Interquartile 75% (IQ3) | 7.9% | 27.5% |
| Interquartile Range (IQR) | 4.2% | 18.6% |
| Standard Deviation (Sample) | 3.8% | 12.9% |
| Standard Deviation (Population) | 3.7% | 12.8% |
Similar Demographics by Family Poverty
Demographics Similar to Soviet Union by Family Poverty
In terms of family poverty, the demographic groups most similar to Soviet Union are Pakistani (8.3%, a difference of 0.040%), Palestinian (8.3%, a difference of 0.10%), Paraguayan (8.3%, a difference of 0.17%), Native Hawaiian (8.3%, a difference of 0.18%), and Icelander (8.3%, a difference of 0.24%).
| Demographics | Rating | Rank | Family Poverty |
| Immigrants | Russia | 93.2 /100 | #117 | Exceptional 8.2% |
| Immigrants | Western Europe | 92.9 /100 | #118 | Exceptional 8.2% |
| French | 92.8 /100 | #119 | Exceptional 8.3% |
| Immigrants | Egypt | 91.6 /100 | #120 | Exceptional 8.3% |
| Native Hawaiians | 91.3 /100 | #121 | Exceptional 8.3% |
| Paraguayans | 91.2 /100 | #122 | Exceptional 8.3% |
| Palestinians | 91.1 /100 | #123 | Exceptional 8.3% |
| Soviet Union | 90.8 /100 | #124 | Exceptional 8.3% |
| Pakistanis | 90.8 /100 | #125 | Exceptional 8.3% |
| Icelanders | 90.3 /100 | #126 | Exceptional 8.3% |
| Immigrants | Hungary | 89.9 /100 | #127 | Excellent 8.4% |
| Argentineans | 89.6 /100 | #128 | Excellent 8.4% |
| Portuguese | 89.2 /100 | #129 | Excellent 8.4% |
| Immigrants | Bosnia and Herzegovina | 88.6 /100 | #130 | Excellent 8.4% |
| Puget Sound Salish | 88.6 /100 | #131 | Excellent 8.4% |
Demographics Similar to Inupiat by Family Poverty
In terms of family poverty, the demographic groups most similar to Inupiat are British West Indian (12.4%, a difference of 0.48%), U.S. Virgin Islander (12.4%, a difference of 0.53%), Immigrants from Grenada (12.4%, a difference of 0.54%), Honduran (12.4%, a difference of 0.76%), and Immigrants from Mexico (12.3%, a difference of 1.5%).
| Demographics | Rating | Rank | Family Poverty |
| Immigrants | Caribbean | 0.0 /100 | #313 | Tragic 12.2% |
| Kiowa | 0.0 /100 | #314 | Tragic 12.2% |
| Immigrants | Mexico | 0.0 /100 | #315 | Tragic 12.3% |
| Hondurans | 0.0 /100 | #316 | Tragic 12.4% |
| Immigrants | Grenada | 0.0 /100 | #317 | Tragic 12.4% |
| U.S. Virgin Islanders | 0.0 /100 | #318 | Tragic 12.4% |
| British West Indians | 0.0 /100 | #319 | Tragic 12.4% |
| Inupiat | 0.0 /100 | #320 | Tragic 12.5% |
| Arapaho | 0.0 /100 | #321 | Tragic 12.7% |
| Immigrants | Honduras | 0.0 /100 | #322 | Tragic 12.7% |
| Menominee | 0.0 /100 | #323 | Tragic 12.7% |
| Immigrants | Dominica | 0.0 /100 | #324 | Tragic 12.7% |
| Paiute | 0.0 /100 | #325 | Tragic 13.0% |
| Colville | 0.0 /100 | #326 | Tragic 13.0% |
| Yakama | 0.0 /100 | #327 | Tragic 13.1% |