Indian (Asian) vs Peruvian Family Poverty
COMPARE
Indian (Asian)
Peruvian
Family Poverty
Family Poverty Comparison
Indians (Asian)
Peruvians
7.7%
FAMILY POVERTY
98.8/ 100
METRIC RATING
52nd/ 347
METRIC RANK
8.8%
FAMILY POVERTY
68.0/ 100
METRIC RATING
159th/ 347
METRIC RANK
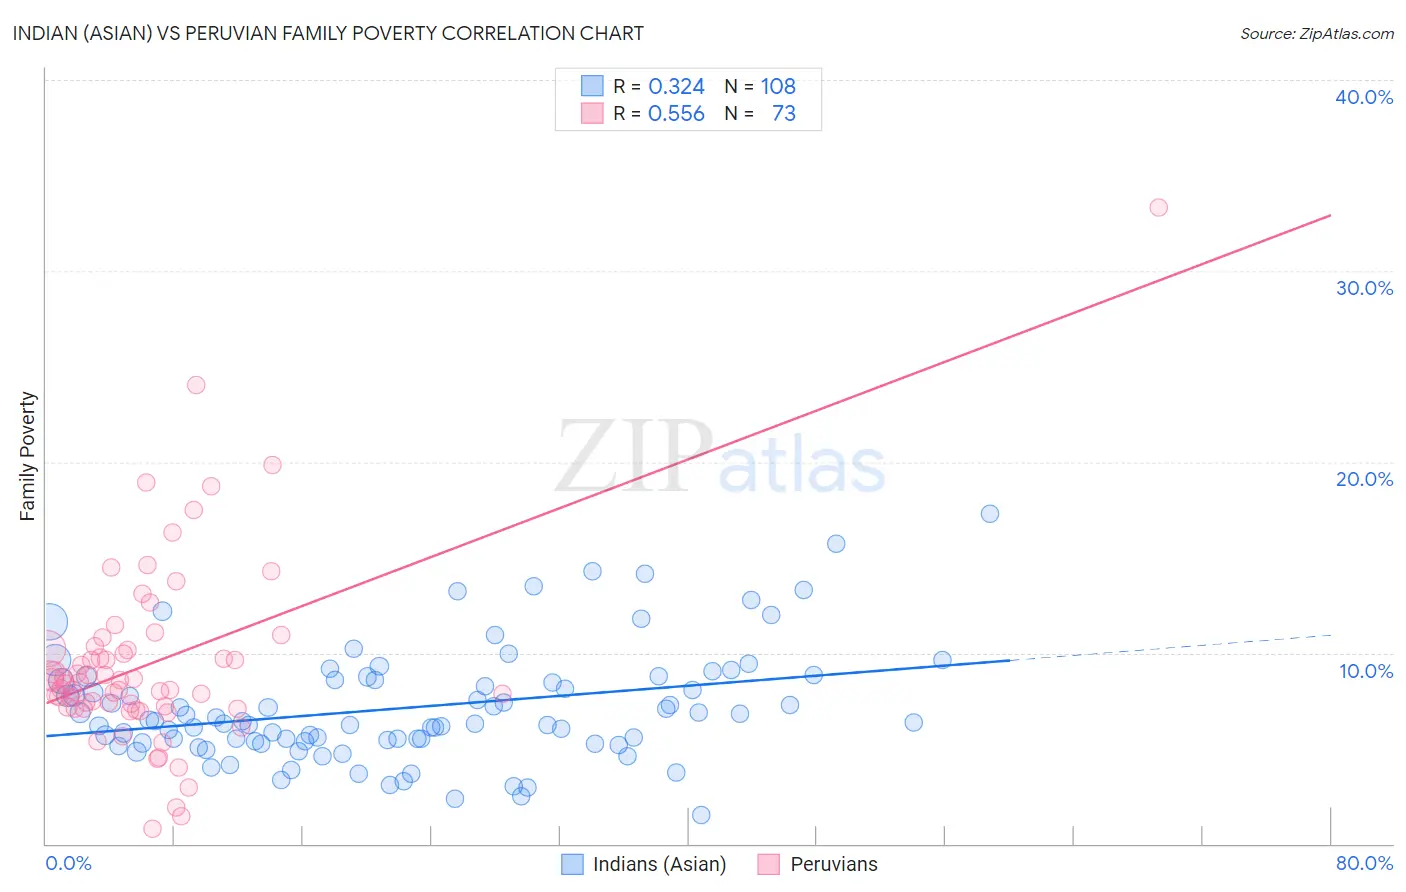
Indian (Asian) vs Peruvian Family Poverty Correlation Chart
The statistical analysis conducted on geographies consisting of 492,769,708 people shows a mild positive correlation between the proportion of Indians (Asian) and poverty level among families in the United States with a correlation coefficient (R) of 0.324 and weighted average of 7.7%. Similarly, the statistical analysis conducted on geographies consisting of 362,496,768 people shows a substantial positive correlation between the proportion of Peruvians and poverty level among families in the United States with a correlation coefficient (R) of 0.556 and weighted average of 8.8%, a difference of 13.9%.
Family Poverty Correlation Summary
| Measurement | Indian (Asian) | Peruvian |
| Minimum | 1.5% | 0.80% |
| Maximum | 17.3% | 33.3% |
| Range | 15.8% | 32.5% |
| Mean | 7.1% | 9.5% |
| Median | 6.4% | 8.5% |
| Interquartile 25% (IQ1) | 5.4% | 7.1% |
| Interquartile 75% (IQ3) | 8.6% | 10.3% |
| Interquartile Range (IQR) | 3.2% | 3.2% |
| Standard Deviation (Sample) | 3.0% | 5.0% |
| Standard Deviation (Population) | 2.9% | 4.9% |
Similar Demographics by Family Poverty
Demographics Similar to Indians (Asian) by Family Poverty
In terms of family poverty, the demographic groups most similar to Indians (Asian) are Swiss (7.7%, a difference of 0.060%), Immigrants from Sweden (7.7%, a difference of 0.070%), Immigrants from Eastern Asia (7.7%, a difference of 0.10%), Immigrants from Serbia (7.7%, a difference of 0.14%), and Immigrants from Moldova (7.7%, a difference of 0.16%).
| Demographics | Rating | Rank | Family Poverty |
| Okinawans | 98.9 /100 | #45 | Exceptional 7.7% |
| Tongans | 98.9 /100 | #46 | Exceptional 7.7% |
| Immigrants | Czechoslovakia | 98.9 /100 | #47 | Exceptional 7.7% |
| Immigrants | Sri Lanka | 98.9 /100 | #48 | Exceptional 7.7% |
| Immigrants | Bolivia | 98.9 /100 | #49 | Exceptional 7.7% |
| Immigrants | North Macedonia | 98.9 /100 | #50 | Exceptional 7.7% |
| Immigrants | Moldova | 98.8 /100 | #51 | Exceptional 7.7% |
| Indians (Asian) | 98.8 /100 | #52 | Exceptional 7.7% |
| Swiss | 98.8 /100 | #53 | Exceptional 7.7% |
| Immigrants | Sweden | 98.8 /100 | #54 | Exceptional 7.7% |
| Immigrants | Eastern Asia | 98.7 /100 | #55 | Exceptional 7.7% |
| Immigrants | Serbia | 98.7 /100 | #56 | Exceptional 7.7% |
| Asians | 98.7 /100 | #57 | Exceptional 7.7% |
| Finns | 98.7 /100 | #58 | Exceptional 7.7% |
| Europeans | 98.7 /100 | #59 | Exceptional 7.7% |
Demographics Similar to Peruvians by Family Poverty
In terms of family poverty, the demographic groups most similar to Peruvians are Hungarian (8.8%, a difference of 0.13%), White/Caucasian (8.8%, a difference of 0.16%), Immigrants from Northern Africa (8.8%, a difference of 0.17%), Tsimshian (8.8%, a difference of 0.20%), and Ethiopian (8.8%, a difference of 0.26%).
| Demographics | Rating | Rank | Family Poverty |
| Samoans | 79.8 /100 | #152 | Good 8.6% |
| Immigrants | Spain | 79.1 /100 | #153 | Good 8.6% |
| Immigrants | Vietnam | 75.4 /100 | #154 | Good 8.7% |
| Immigrants | Kuwait | 73.6 /100 | #155 | Good 8.7% |
| Immigrants | Oceania | 71.2 /100 | #156 | Good 8.7% |
| Tsimshian | 69.3 /100 | #157 | Good 8.8% |
| Whites/Caucasians | 69.1 /100 | #158 | Good 8.8% |
| Peruvians | 68.0 /100 | #159 | Good 8.8% |
| Hungarians | 67.2 /100 | #160 | Good 8.8% |
| Immigrants | Northern Africa | 66.9 /100 | #161 | Good 8.8% |
| Ethiopians | 66.3 /100 | #162 | Good 8.8% |
| Pennsylvania Germans | 66.0 /100 | #163 | Good 8.8% |
| Celtics | 64.9 /100 | #164 | Good 8.8% |
| Guamanians/Chamorros | 64.7 /100 | #165 | Good 8.8% |
| Afghans | 63.5 /100 | #166 | Good 8.8% |