South African vs Immigrants from Yemen Hearing Disability
COMPARE
South African
Immigrants from Yemen
Hearing Disability
Hearing Disability Comparison
South Africans
Immigrants from Yemen
3.1%
HEARING DISABILITY
24.5/ 100
METRIC RATING
194th/ 347
METRIC RANK
2.8%
HEARING DISABILITY
92.7/ 100
METRIC RATING
111th/ 347
METRIC RANK
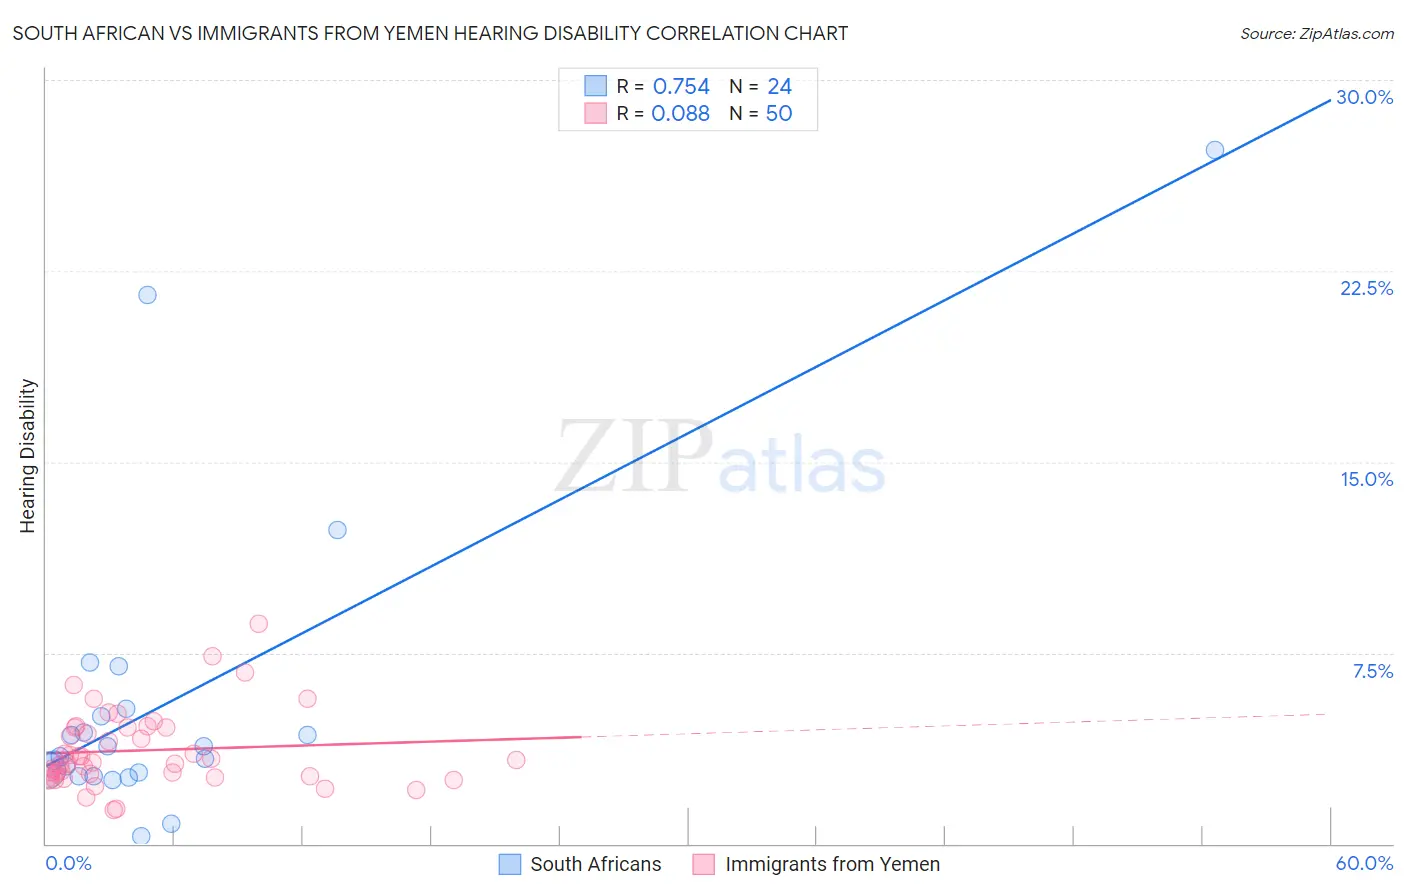
South African vs Immigrants from Yemen Hearing Disability Correlation Chart
The statistical analysis conducted on geographies consisting of 182,558,615 people shows a strong positive correlation between the proportion of South Africans and percentage of population with hearing disability in the United States with a correlation coefficient (R) of 0.754 and weighted average of 3.1%. Similarly, the statistical analysis conducted on geographies consisting of 82,433,214 people shows a slight positive correlation between the proportion of Immigrants from Yemen and percentage of population with hearing disability in the United States with a correlation coefficient (R) of 0.088 and weighted average of 2.8%, a difference of 9.2%.
Hearing Disability Correlation Summary
| Measurement | South African | Immigrants from Yemen |
| Minimum | 0.31% | 1.3% |
| Maximum | 27.3% | 8.6% |
| Range | 27.0% | 7.3% |
| Mean | 5.7% | 3.7% |
| Median | 3.6% | 3.2% |
| Interquartile 25% (IQ1) | 2.7% | 2.7% |
| Interquartile 75% (IQ3) | 5.2% | 4.6% |
| Interquartile Range (IQR) | 2.4% | 1.9% |
| Standard Deviation (Sample) | 6.3% | 1.5% |
| Standard Deviation (Population) | 6.2% | 1.5% |
Similar Demographics by Hearing Disability
Demographics Similar to South Africans by Hearing Disability
In terms of hearing disability, the demographic groups most similar to South Africans are Spanish American Indian (3.1%, a difference of 0.050%), Immigrants from Europe (3.1%, a difference of 0.21%), Macedonian (3.1%, a difference of 0.30%), Korean (3.1%, a difference of 0.37%), and Immigrants from Switzerland (3.1%, a difference of 0.51%).
| Demographics | Rating | Rank | Hearing Disability |
| Blacks/African Americans | 34.7 /100 | #187 | Fair 3.0% |
| Mexican American Indians | 34.7 /100 | #188 | Fair 3.0% |
| Africans | 32.9 /100 | #189 | Fair 3.0% |
| Immigrants | South Africa | 31.1 /100 | #190 | Fair 3.1% |
| Immigrants | Switzerland | 28.8 /100 | #191 | Fair 3.1% |
| Koreans | 27.6 /100 | #192 | Fair 3.1% |
| Macedonians | 27.0 /100 | #193 | Fair 3.1% |
| South Africans | 24.5 /100 | #194 | Fair 3.1% |
| Spanish American Indians | 24.1 /100 | #195 | Fair 3.1% |
| Immigrants | Europe | 22.9 /100 | #196 | Fair 3.1% |
| Immigrants | Bosnia and Herzegovina | 20.6 /100 | #197 | Fair 3.1% |
| Immigrants | Croatia | 20.5 /100 | #198 | Fair 3.1% |
| Syrians | 19.2 /100 | #199 | Poor 3.1% |
| Immigrants | North Macedonia | 19.1 /100 | #200 | Poor 3.1% |
| Iraqis | 19.0 /100 | #201 | Poor 3.1% |
Demographics Similar to Immigrants from Yemen by Hearing Disability
In terms of hearing disability, the demographic groups most similar to Immigrants from Yemen are Cypriot (2.8%, a difference of 0.050%), U.S. Virgin Islander (2.8%, a difference of 0.070%), Turkish (2.8%, a difference of 0.10%), Guatemalan (2.8%, a difference of 0.17%), and Honduran (2.8%, a difference of 0.25%).
| Demographics | Rating | Rank | Hearing Disability |
| Burmese | 94.2 /100 | #104 | Exceptional 2.8% |
| Moroccans | 93.9 /100 | #105 | Exceptional 2.8% |
| Hondurans | 93.4 /100 | #106 | Exceptional 2.8% |
| Immigrants | Chile | 93.4 /100 | #107 | Exceptional 2.8% |
| Guatemalans | 93.2 /100 | #108 | Exceptional 2.8% |
| Turks | 93.0 /100 | #109 | Exceptional 2.8% |
| Cypriots | 92.9 /100 | #110 | Exceptional 2.8% |
| Immigrants | Yemen | 92.7 /100 | #111 | Exceptional 2.8% |
| U.S. Virgin Islanders | 92.5 /100 | #112 | Exceptional 2.8% |
| Immigrants | Belarus | 91.6 /100 | #113 | Exceptional 2.8% |
| Cambodians | 91.1 /100 | #114 | Exceptional 2.8% |
| Immigrants | Latin America | 90.5 /100 | #115 | Exceptional 2.8% |
| Immigrants | Immigrants | 90.3 /100 | #116 | Exceptional 2.8% |
| Immigrants | Liberia | 90.0 /100 | #117 | Excellent 2.8% |
| Zimbabweans | 89.9 /100 | #118 | Excellent 2.8% |