Slovak vs Jamaican Single Male Poverty
COMPARE
Slovak
Jamaican
Single Male Poverty
Single Male Poverty Comparison
Slovaks
Jamaicans
14.1%
SINGLE MALE POVERTY
0.0/ 100
METRIC RATING
278th/ 347
METRIC RANK
13.2%
SINGLE MALE POVERTY
7.7/ 100
METRIC RATING
226th/ 347
METRIC RANK
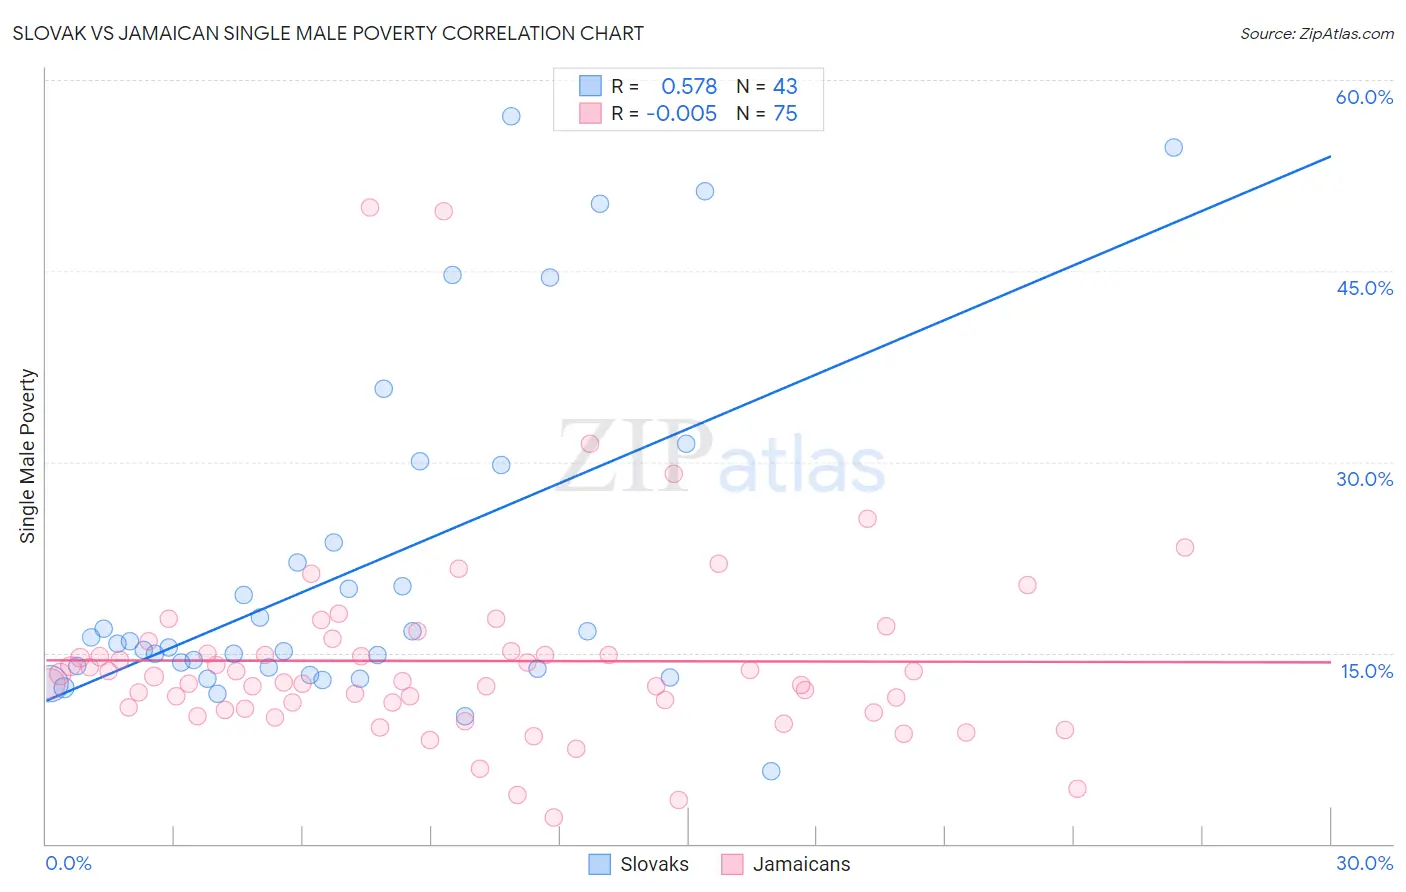
Slovak vs Jamaican Single Male Poverty Correlation Chart
The statistical analysis conducted on geographies consisting of 343,124,767 people shows a substantial positive correlation between the proportion of Slovaks and poverty level among single males in the United States with a correlation coefficient (R) of 0.578 and weighted average of 14.1%. Similarly, the statistical analysis conducted on geographies consisting of 330,158,708 people shows no correlation between the proportion of Jamaicans and poverty level among single males in the United States with a correlation coefficient (R) of -0.005 and weighted average of 13.2%, a difference of 6.6%.
Single Male Poverty Correlation Summary
| Measurement | Slovak | Jamaican |
| Minimum | 5.7% | 2.1% |
| Maximum | 57.1% | 50.0% |
| Range | 51.4% | 47.9% |
| Mean | 21.6% | 14.4% |
| Median | 15.7% | 12.7% |
| Interquartile 25% (IQ1) | 13.8% | 10.6% |
| Interquartile 75% (IQ3) | 23.6% | 15.2% |
| Interquartile Range (IQR) | 9.9% | 4.5% |
| Standard Deviation (Sample) | 13.2% | 7.8% |
| Standard Deviation (Population) | 13.0% | 7.8% |
Similar Demographics by Single Male Poverty
Demographics Similar to Slovaks by Single Male Poverty
In terms of single male poverty, the demographic groups most similar to Slovaks are Indonesian (14.1%, a difference of 0.040%), Immigrants from Honduras (14.1%, a difference of 0.060%), Dutch (14.1%, a difference of 0.10%), English (14.1%, a difference of 0.22%), and Honduran (14.0%, a difference of 0.30%).
| Demographics | Rating | Rank | Single Male Poverty |
| Irish | 0.1 /100 | #271 | Tragic 14.0% |
| Mexicans | 0.1 /100 | #272 | Tragic 14.0% |
| Welsh | 0.1 /100 | #273 | Tragic 14.0% |
| Hondurans | 0.1 /100 | #274 | Tragic 14.0% |
| English | 0.1 /100 | #275 | Tragic 14.1% |
| Dutch | 0.1 /100 | #276 | Tragic 14.1% |
| Immigrants | Honduras | 0.0 /100 | #277 | Tragic 14.1% |
| Slovaks | 0.0 /100 | #278 | Tragic 14.1% |
| Indonesians | 0.0 /100 | #279 | Tragic 14.1% |
| Hmong | 0.0 /100 | #280 | Tragic 14.2% |
| Hispanics or Latinos | 0.0 /100 | #281 | Tragic 14.2% |
| Spanish Americans | 0.0 /100 | #282 | Tragic 14.2% |
| Yaqui | 0.0 /100 | #283 | Tragic 14.2% |
| Immigrants | Bahamas | 0.0 /100 | #284 | Tragic 14.4% |
| French | 0.0 /100 | #285 | Tragic 14.4% |
Demographics Similar to Jamaicans by Single Male Poverty
In terms of single male poverty, the demographic groups most similar to Jamaicans are Haitian (13.2%, a difference of 0.13%), Immigrants from Denmark (13.2%, a difference of 0.16%), Lebanese (13.2%, a difference of 0.21%), Somali (13.2%, a difference of 0.22%), and Immigrants from the Azores (13.2%, a difference of 0.25%).
| Demographics | Rating | Rank | Single Male Poverty |
| Immigrants | Burma/Myanmar | 12.6 /100 | #219 | Poor 13.1% |
| Central Americans | 10.9 /100 | #220 | Poor 13.2% |
| New Zealanders | 10.7 /100 | #221 | Poor 13.2% |
| Immigrants | Western Europe | 10.0 /100 | #222 | Poor 13.2% |
| Immigrants | Azores | 9.3 /100 | #223 | Tragic 13.2% |
| Somalis | 9.1 /100 | #224 | Tragic 13.2% |
| Immigrants | Denmark | 8.7 /100 | #225 | Tragic 13.2% |
| Jamaicans | 7.7 /100 | #226 | Tragic 13.2% |
| Haitians | 7.0 /100 | #227 | Tragic 13.2% |
| Lebanese | 6.6 /100 | #228 | Tragic 13.2% |
| Europeans | 6.2 /100 | #229 | Tragic 13.3% |
| Ghanaians | 6.1 /100 | #230 | Tragic 13.3% |
| Slavs | 5.3 /100 | #231 | Tragic 13.3% |
| Immigrants | Caribbean | 5.0 /100 | #232 | Tragic 13.3% |
| British | 4.0 /100 | #233 | Tragic 13.3% |