Slovak vs Immigrants from Netherlands Male Unemployment
COMPARE
Slovak
Immigrants from Netherlands
Male Unemployment
Male Unemployment Comparison
Slovaks
Immigrants from Netherlands
5.2%
MALE UNEMPLOYMENT
75.5/ 100
METRIC RATING
151st/ 347
METRIC RANK
5.0%
MALE UNEMPLOYMENT
98.3/ 100
METRIC RATING
59th/ 347
METRIC RANK
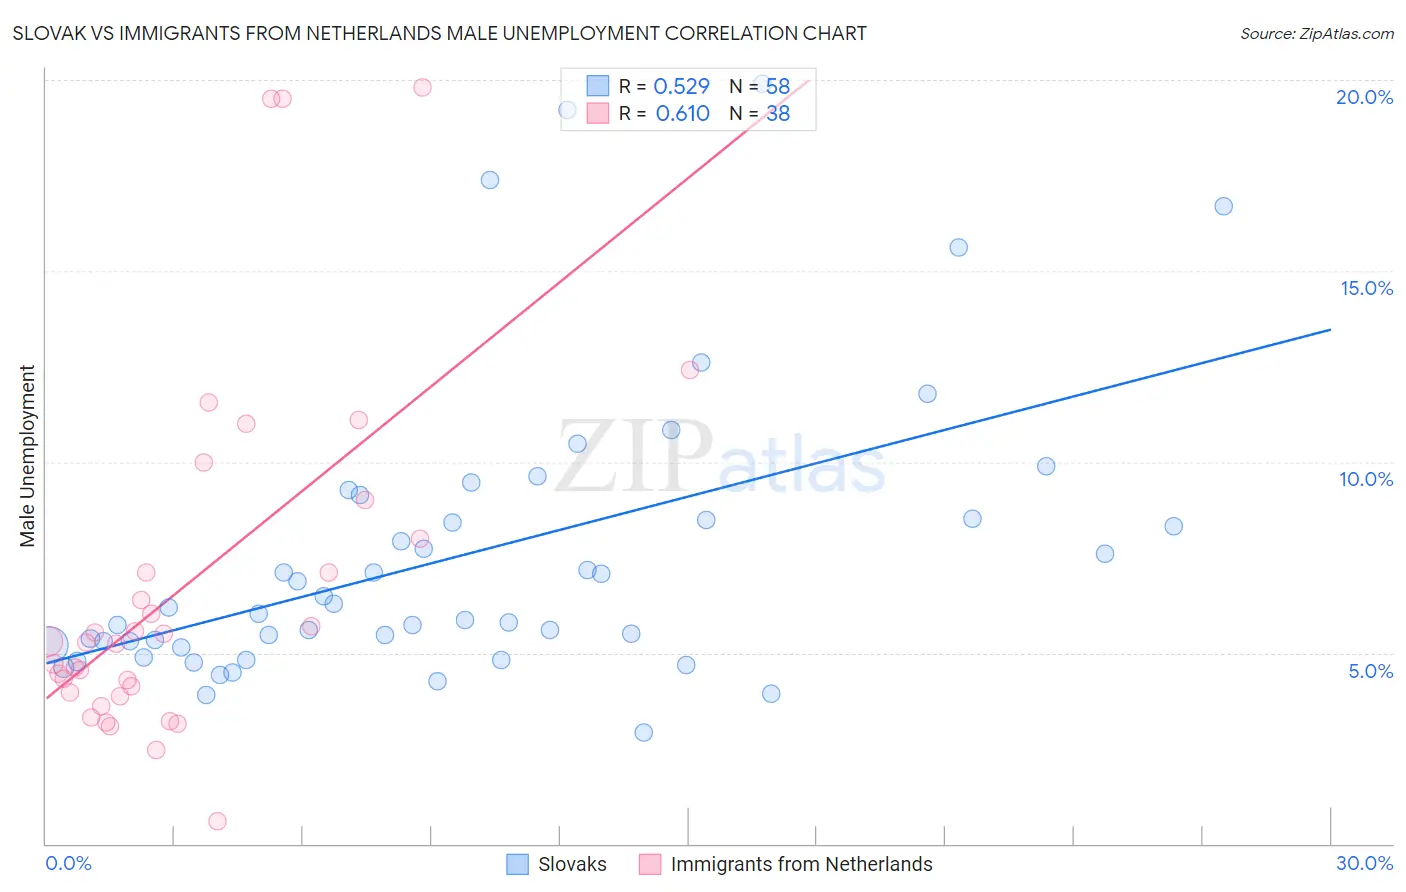
Slovak vs Immigrants from Netherlands Male Unemployment Correlation Chart
The statistical analysis conducted on geographies consisting of 395,477,996 people shows a substantial positive correlation between the proportion of Slovaks and unemployment rate among males in the United States with a correlation coefficient (R) of 0.529 and weighted average of 5.2%. Similarly, the statistical analysis conducted on geographies consisting of 237,368,894 people shows a significant positive correlation between the proportion of Immigrants from Netherlands and unemployment rate among males in the United States with a correlation coefficient (R) of 0.610 and weighted average of 5.0%, a difference of 4.6%.
Male Unemployment Correlation Summary
| Measurement | Slovak | Immigrants from Netherlands |
| Minimum | 2.9% | 0.60% |
| Maximum | 19.9% | 19.8% |
| Range | 17.0% | 19.2% |
| Mean | 7.6% | 6.8% |
| Median | 6.1% | 5.3% |
| Interquartile 25% (IQ1) | 5.2% | 4.0% |
| Interquartile 75% (IQ3) | 8.5% | 8.0% |
| Interquartile Range (IQR) | 3.3% | 4.0% |
| Standard Deviation (Sample) | 3.8% | 4.7% |
| Standard Deviation (Population) | 3.8% | 4.6% |
Similar Demographics by Male Unemployment
Demographics Similar to Slovaks by Male Unemployment
In terms of male unemployment, the demographic groups most similar to Slovaks are Indian (Asian) (5.2%, a difference of 0.040%), Egyptian (5.2%, a difference of 0.050%), Immigrants from Italy (5.2%, a difference of 0.060%), Immigrants from Europe (5.2%, a difference of 0.060%), and Immigrants from Uruguay (5.2%, a difference of 0.13%).
| Demographics | Rating | Rank | Male Unemployment |
| Sri Lankans | 77.9 /100 | #144 | Good 5.2% |
| Macedonians | 77.7 /100 | #145 | Good 5.2% |
| Immigrants | Kenya | 77.6 /100 | #146 | Good 5.2% |
| Immigrants | Burma/Myanmar | 77.5 /100 | #147 | Good 5.2% |
| Immigrants | Italy | 76.3 /100 | #148 | Good 5.2% |
| Immigrants | Europe | 76.2 /100 | #149 | Good 5.2% |
| Indians (Asian) | 76.0 /100 | #150 | Good 5.2% |
| Slovaks | 75.5 /100 | #151 | Good 5.2% |
| Egyptians | 74.8 /100 | #152 | Good 5.2% |
| Immigrants | Uruguay | 73.9 /100 | #153 | Good 5.2% |
| Laotians | 73.8 /100 | #154 | Good 5.2% |
| Immigrants | Hungary | 73.4 /100 | #155 | Good 5.2% |
| Americans | 72.7 /100 | #156 | Good 5.2% |
| Immigrants | Northern Africa | 72.3 /100 | #157 | Good 5.2% |
| Immigrants | Indonesia | 71.5 /100 | #158 | Good 5.2% |
Demographics Similar to Immigrants from Netherlands by Male Unemployment
In terms of male unemployment, the demographic groups most similar to Immigrants from Netherlands are Turkish (5.0%, a difference of 0.14%), Lithuanian (5.0%, a difference of 0.14%), Immigrants from Argentina (5.0%, a difference of 0.18%), Cambodian (5.0%, a difference of 0.26%), and Immigrants from Bulgaria (5.0%, a difference of 0.37%).
| Demographics | Rating | Rank | Male Unemployment |
| Irish | 98.8 /100 | #52 | Exceptional 5.0% |
| Jordanians | 98.8 /100 | #53 | Exceptional 5.0% |
| Yugoslavians | 98.7 /100 | #54 | Exceptional 5.0% |
| Czechoslovakians | 98.7 /100 | #55 | Exceptional 5.0% |
| Immigrants | Bulgaria | 98.7 /100 | #56 | Exceptional 5.0% |
| Turks | 98.5 /100 | #57 | Exceptional 5.0% |
| Lithuanians | 98.5 /100 | #58 | Exceptional 5.0% |
| Immigrants | Netherlands | 98.3 /100 | #59 | Exceptional 5.0% |
| Immigrants | Argentina | 98.1 /100 | #60 | Exceptional 5.0% |
| Cambodians | 98.1 /100 | #61 | Exceptional 5.0% |
| Basques | 97.9 /100 | #62 | Exceptional 5.0% |
| Eastern Europeans | 97.9 /100 | #63 | Exceptional 5.0% |
| Celtics | 97.8 /100 | #64 | Exceptional 5.0% |
| Icelanders | 97.6 /100 | #65 | Exceptional 5.0% |
| Finns | 97.5 /100 | #66 | Exceptional 5.0% |