Slovak vs Immigrants from Asia Single Male Poverty
COMPARE
Slovak
Immigrants from Asia
Single Male Poverty
Single Male Poverty Comparison
Slovaks
Immigrants from Asia
14.1%
SINGLE MALE POVERTY
0.0/ 100
METRIC RATING
278th/ 347
METRIC RANK
11.4%
SINGLE MALE POVERTY
100.0/ 100
METRIC RATING
28th/ 347
METRIC RANK
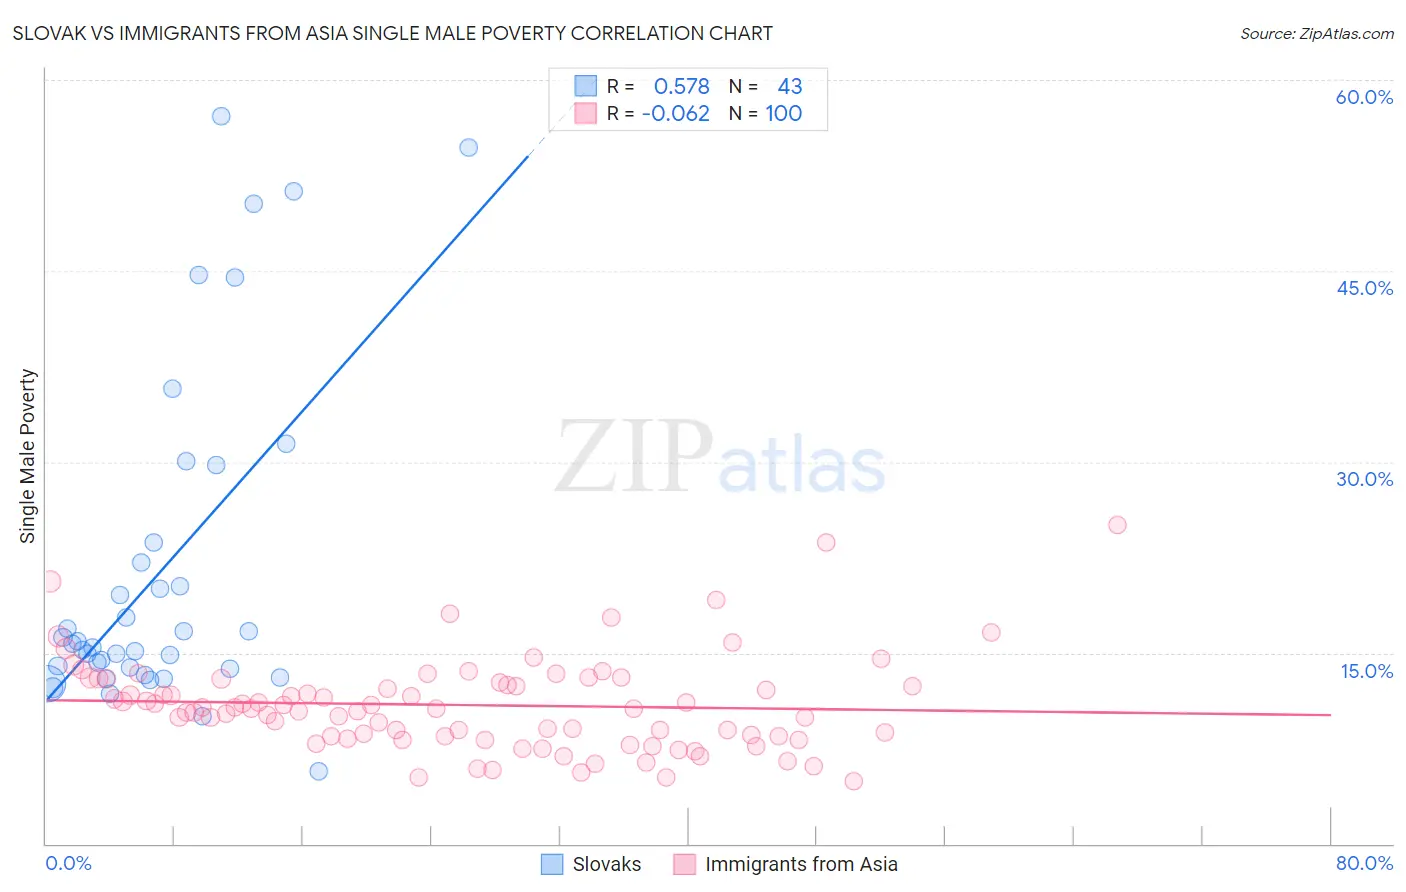
Slovak vs Immigrants from Asia Single Male Poverty Correlation Chart
The statistical analysis conducted on geographies consisting of 343,124,767 people shows a substantial positive correlation between the proportion of Slovaks and poverty level among single males in the United States with a correlation coefficient (R) of 0.578 and weighted average of 14.1%. Similarly, the statistical analysis conducted on geographies consisting of 461,688,534 people shows a slight negative correlation between the proportion of Immigrants from Asia and poverty level among single males in the United States with a correlation coefficient (R) of -0.062 and weighted average of 11.4%, a difference of 23.8%.
Single Male Poverty Correlation Summary
| Measurement | Slovak | Immigrants from Asia |
| Minimum | 5.7% | 4.9% |
| Maximum | 57.1% | 25.0% |
| Range | 51.4% | 20.1% |
| Mean | 21.6% | 10.9% |
| Median | 15.7% | 10.6% |
| Interquartile 25% (IQ1) | 13.8% | 8.4% |
| Interquartile 75% (IQ3) | 23.6% | 12.8% |
| Interquartile Range (IQR) | 9.9% | 4.4% |
| Standard Deviation (Sample) | 13.2% | 3.7% |
| Standard Deviation (Population) | 13.0% | 3.6% |
Similar Demographics by Single Male Poverty
Demographics Similar to Slovaks by Single Male Poverty
In terms of single male poverty, the demographic groups most similar to Slovaks are Indonesian (14.1%, a difference of 0.040%), Immigrants from Honduras (14.1%, a difference of 0.060%), Dutch (14.1%, a difference of 0.10%), English (14.1%, a difference of 0.22%), and Honduran (14.0%, a difference of 0.30%).
| Demographics | Rating | Rank | Single Male Poverty |
| Irish | 0.1 /100 | #271 | Tragic 14.0% |
| Mexicans | 0.1 /100 | #272 | Tragic 14.0% |
| Welsh | 0.1 /100 | #273 | Tragic 14.0% |
| Hondurans | 0.1 /100 | #274 | Tragic 14.0% |
| English | 0.1 /100 | #275 | Tragic 14.1% |
| Dutch | 0.1 /100 | #276 | Tragic 14.1% |
| Immigrants | Honduras | 0.0 /100 | #277 | Tragic 14.1% |
| Slovaks | 0.0 /100 | #278 | Tragic 14.1% |
| Indonesians | 0.0 /100 | #279 | Tragic 14.1% |
| Hmong | 0.0 /100 | #280 | Tragic 14.2% |
| Hispanics or Latinos | 0.0 /100 | #281 | Tragic 14.2% |
| Spanish Americans | 0.0 /100 | #282 | Tragic 14.2% |
| Yaqui | 0.0 /100 | #283 | Tragic 14.2% |
| Immigrants | Bahamas | 0.0 /100 | #284 | Tragic 14.4% |
| French | 0.0 /100 | #285 | Tragic 14.4% |
Demographics Similar to Immigrants from Asia by Single Male Poverty
In terms of single male poverty, the demographic groups most similar to Immigrants from Asia are Immigrants from China (11.4%, a difference of 0.070%), Immigrants from Egypt (11.4%, a difference of 0.10%), Iranian (11.4%, a difference of 0.16%), Immigrants from Iran (11.4%, a difference of 0.25%), and Immigrants from Eastern Asia (11.4%, a difference of 0.34%).
| Demographics | Rating | Rank | Single Male Poverty |
| Asians | 100.0 /100 | #21 | Exceptional 11.2% |
| Immigrants | Pakistan | 100.0 /100 | #22 | Exceptional 11.2% |
| Bolivians | 100.0 /100 | #23 | Exceptional 11.2% |
| Indians (Asian) | 100.0 /100 | #24 | Exceptional 11.3% |
| Maltese | 100.0 /100 | #25 | Exceptional 11.3% |
| Immigrants | Japan | 100.0 /100 | #26 | Exceptional 11.3% |
| Immigrants | China | 100.0 /100 | #27 | Exceptional 11.4% |
| Immigrants | Asia | 100.0 /100 | #28 | Exceptional 11.4% |
| Immigrants | Egypt | 100.0 /100 | #29 | Exceptional 11.4% |
| Iranians | 100.0 /100 | #30 | Exceptional 11.4% |
| Immigrants | Iran | 100.0 /100 | #31 | Exceptional 11.4% |
| Immigrants | Eastern Asia | 100.0 /100 | #32 | Exceptional 11.4% |
| Immigrants | Vietnam | 100.0 /100 | #33 | Exceptional 11.4% |
| Immigrants | Ethiopia | 100.0 /100 | #34 | Exceptional 11.4% |
| Immigrants | South Eastern Asia | 100.0 /100 | #35 | Exceptional 11.4% |