Slovak vs Immigrants from Northern Africa Single Male Poverty
COMPARE
Slovak
Immigrants from Northern Africa
Single Male Poverty
Single Male Poverty Comparison
Slovaks
Immigrants from Northern Africa
14.1%
SINGLE MALE POVERTY
0.0/ 100
METRIC RATING
278th/ 347
METRIC RANK
11.9%
SINGLE MALE POVERTY
99.4/ 100
METRIC RATING
76th/ 347
METRIC RANK
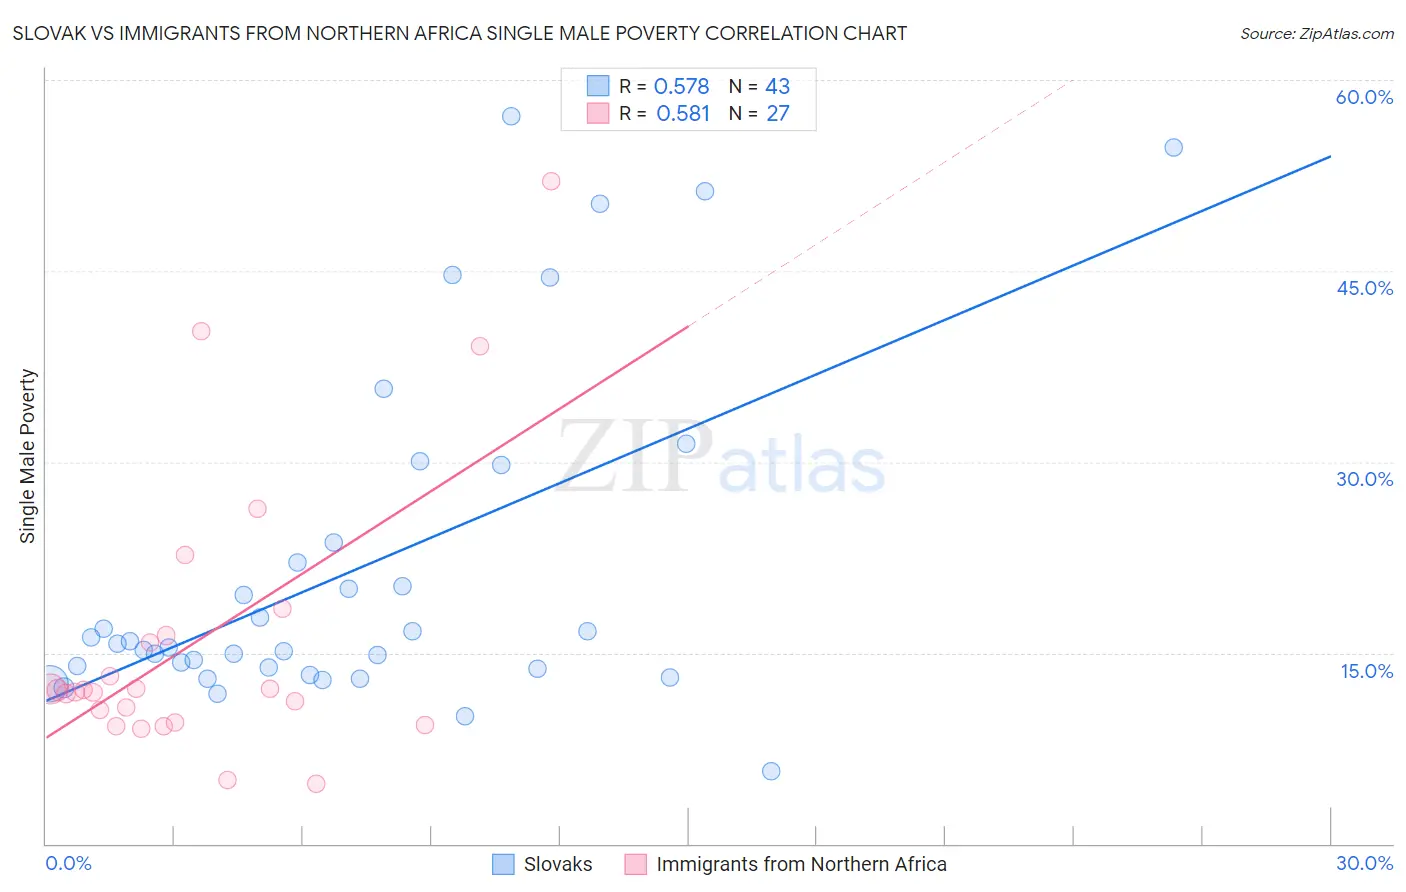
Slovak vs Immigrants from Northern Africa Single Male Poverty Correlation Chart
The statistical analysis conducted on geographies consisting of 343,124,767 people shows a substantial positive correlation between the proportion of Slovaks and poverty level among single males in the United States with a correlation coefficient (R) of 0.578 and weighted average of 14.1%. Similarly, the statistical analysis conducted on geographies consisting of 289,323,815 people shows a substantial positive correlation between the proportion of Immigrants from Northern Africa and poverty level among single males in the United States with a correlation coefficient (R) of 0.581 and weighted average of 11.9%, a difference of 18.0%.
Single Male Poverty Correlation Summary
| Measurement | Slovak | Immigrants from Northern Africa |
| Minimum | 5.7% | 4.7% |
| Maximum | 57.1% | 52.0% |
| Range | 51.4% | 47.3% |
| Mean | 21.6% | 15.9% |
| Median | 15.7% | 12.0% |
| Interquartile 25% (IQ1) | 13.8% | 9.6% |
| Interquartile 75% (IQ3) | 23.6% | 16.4% |
| Interquartile Range (IQR) | 9.9% | 6.8% |
| Standard Deviation (Sample) | 13.2% | 11.2% |
| Standard Deviation (Population) | 13.0% | 11.0% |
Similar Demographics by Single Male Poverty
Demographics Similar to Slovaks by Single Male Poverty
In terms of single male poverty, the demographic groups most similar to Slovaks are Indonesian (14.1%, a difference of 0.040%), Immigrants from Honduras (14.1%, a difference of 0.060%), Dutch (14.1%, a difference of 0.10%), English (14.1%, a difference of 0.22%), and Honduran (14.0%, a difference of 0.30%).
| Demographics | Rating | Rank | Single Male Poverty |
| Irish | 0.1 /100 | #271 | Tragic 14.0% |
| Mexicans | 0.1 /100 | #272 | Tragic 14.0% |
| Welsh | 0.1 /100 | #273 | Tragic 14.0% |
| Hondurans | 0.1 /100 | #274 | Tragic 14.0% |
| English | 0.1 /100 | #275 | Tragic 14.1% |
| Dutch | 0.1 /100 | #276 | Tragic 14.1% |
| Immigrants | Honduras | 0.0 /100 | #277 | Tragic 14.1% |
| Slovaks | 0.0 /100 | #278 | Tragic 14.1% |
| Indonesians | 0.0 /100 | #279 | Tragic 14.1% |
| Hmong | 0.0 /100 | #280 | Tragic 14.2% |
| Hispanics or Latinos | 0.0 /100 | #281 | Tragic 14.2% |
| Spanish Americans | 0.0 /100 | #282 | Tragic 14.2% |
| Yaqui | 0.0 /100 | #283 | Tragic 14.2% |
| Immigrants | Bahamas | 0.0 /100 | #284 | Tragic 14.4% |
| French | 0.0 /100 | #285 | Tragic 14.4% |
Demographics Similar to Immigrants from Northern Africa by Single Male Poverty
In terms of single male poverty, the demographic groups most similar to Immigrants from Northern Africa are Uruguayan (11.9%, a difference of 0.020%), Chilean (11.9%, a difference of 0.22%), Immigrants from Malaysia (12.0%, a difference of 0.26%), Argentinean (11.9%, a difference of 0.27%), and Immigrants from Argentina (11.9%, a difference of 0.40%).
| Demographics | Rating | Rank | Single Male Poverty |
| Immigrants | Russia | 99.6 /100 | #69 | Exceptional 11.9% |
| Immigrants | Nepal | 99.6 /100 | #70 | Exceptional 11.9% |
| Immigrants | Greece | 99.6 /100 | #71 | Exceptional 11.9% |
| Immigrants | Argentina | 99.5 /100 | #72 | Exceptional 11.9% |
| Argentineans | 99.5 /100 | #73 | Exceptional 11.9% |
| Chileans | 99.5 /100 | #74 | Exceptional 11.9% |
| Uruguayans | 99.4 /100 | #75 | Exceptional 11.9% |
| Immigrants | Northern Africa | 99.4 /100 | #76 | Exceptional 11.9% |
| Immigrants | Malaysia | 99.2 /100 | #77 | Exceptional 12.0% |
| Immigrants | Venezuela | 99.1 /100 | #78 | Exceptional 12.0% |
| Immigrants | Belgium | 99.0 /100 | #79 | Exceptional 12.0% |
| Armenians | 98.7 /100 | #80 | Exceptional 12.1% |
| Immigrants | South America | 98.7 /100 | #81 | Exceptional 12.1% |
| Immigrants | Colombia | 98.6 /100 | #82 | Exceptional 12.1% |
| Immigrants | Chile | 98.6 /100 | #83 | Exceptional 12.1% |