Slovak vs Immigrants from Belize Single Male Poverty
COMPARE
Slovak
Immigrants from Belize
Single Male Poverty
Single Male Poverty Comparison
Slovaks
Immigrants from Belize
14.1%
SINGLE MALE POVERTY
0.0/ 100
METRIC RATING
278th/ 347
METRIC RANK
13.7%
SINGLE MALE POVERTY
0.4/ 100
METRIC RATING
256th/ 347
METRIC RANK
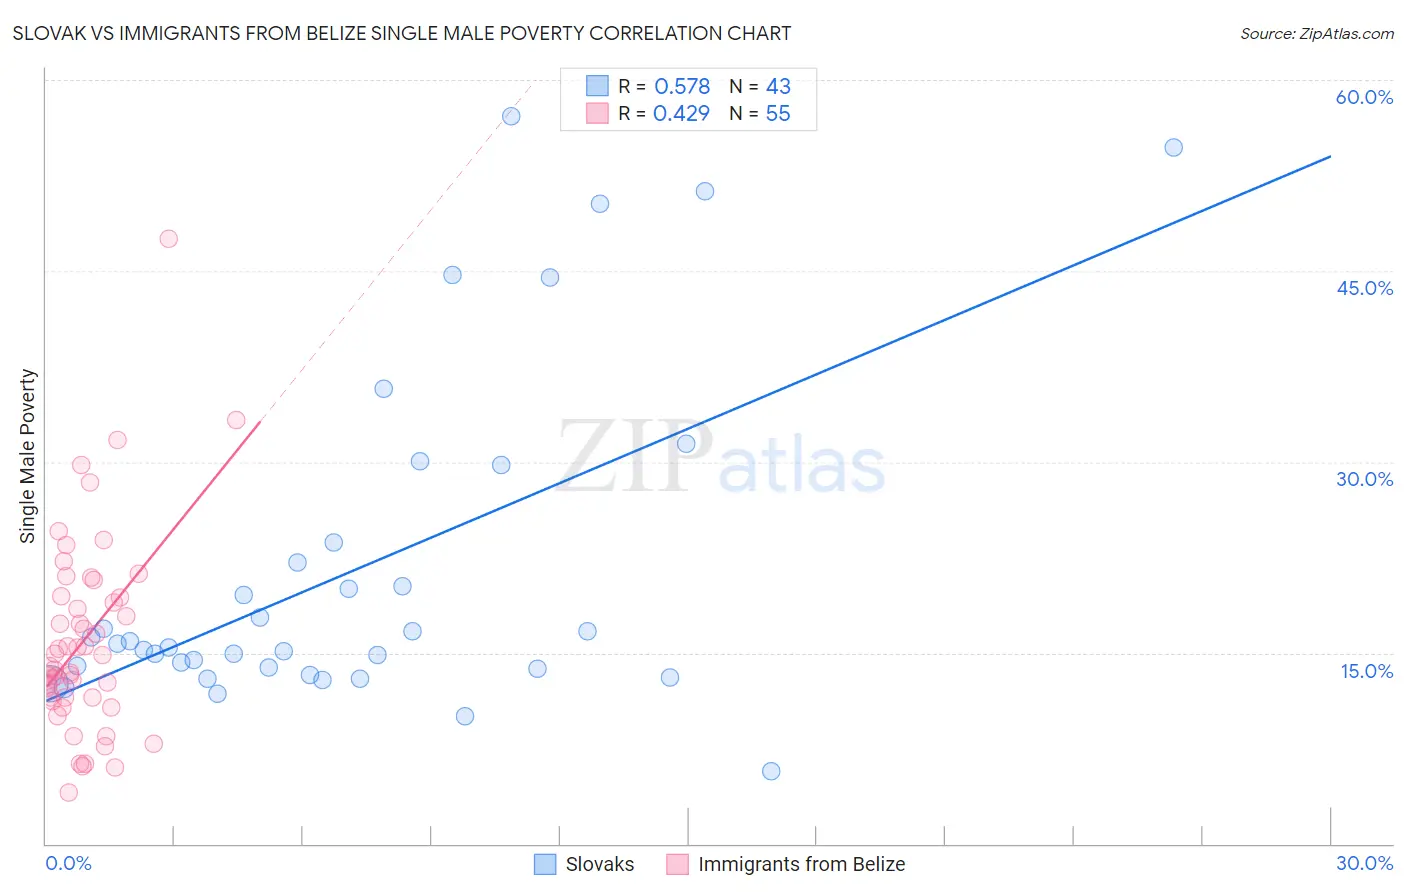
Slovak vs Immigrants from Belize Single Male Poverty Correlation Chart
The statistical analysis conducted on geographies consisting of 343,124,767 people shows a substantial positive correlation between the proportion of Slovaks and poverty level among single males in the United States with a correlation coefficient (R) of 0.578 and weighted average of 14.1%. Similarly, the statistical analysis conducted on geographies consisting of 125,025,572 people shows a moderate positive correlation between the proportion of Immigrants from Belize and poverty level among single males in the United States with a correlation coefficient (R) of 0.429 and weighted average of 13.7%, a difference of 2.7%.
Single Male Poverty Correlation Summary
| Measurement | Slovak | Immigrants from Belize |
| Minimum | 5.7% | 4.0% |
| Maximum | 57.1% | 47.5% |
| Range | 51.4% | 43.5% |
| Mean | 21.6% | 16.1% |
| Median | 15.7% | 14.8% |
| Interquartile 25% (IQ1) | 13.8% | 11.5% |
| Interquartile 75% (IQ3) | 23.6% | 19.5% |
| Interquartile Range (IQR) | 9.9% | 8.0% |
| Standard Deviation (Sample) | 13.2% | 7.8% |
| Standard Deviation (Population) | 13.0% | 7.8% |
Similar Demographics by Single Male Poverty
Demographics Similar to Slovaks by Single Male Poverty
In terms of single male poverty, the demographic groups most similar to Slovaks are Indonesian (14.1%, a difference of 0.040%), Immigrants from Honduras (14.1%, a difference of 0.060%), Dutch (14.1%, a difference of 0.10%), English (14.1%, a difference of 0.22%), and Honduran (14.0%, a difference of 0.30%).
| Demographics | Rating | Rank | Single Male Poverty |
| Irish | 0.1 /100 | #271 | Tragic 14.0% |
| Mexicans | 0.1 /100 | #272 | Tragic 14.0% |
| Welsh | 0.1 /100 | #273 | Tragic 14.0% |
| Hondurans | 0.1 /100 | #274 | Tragic 14.0% |
| English | 0.1 /100 | #275 | Tragic 14.1% |
| Dutch | 0.1 /100 | #276 | Tragic 14.1% |
| Immigrants | Honduras | 0.0 /100 | #277 | Tragic 14.1% |
| Slovaks | 0.0 /100 | #278 | Tragic 14.1% |
| Indonesians | 0.0 /100 | #279 | Tragic 14.1% |
| Hmong | 0.0 /100 | #280 | Tragic 14.2% |
| Hispanics or Latinos | 0.0 /100 | #281 | Tragic 14.2% |
| Spanish Americans | 0.0 /100 | #282 | Tragic 14.2% |
| Yaqui | 0.0 /100 | #283 | Tragic 14.2% |
| Immigrants | Bahamas | 0.0 /100 | #284 | Tragic 14.4% |
| French | 0.0 /100 | #285 | Tragic 14.4% |
Demographics Similar to Immigrants from Belize by Single Male Poverty
In terms of single male poverty, the demographic groups most similar to Immigrants from Belize are Spaniard (13.7%, a difference of 0.10%), Immigrants from Central America (13.8%, a difference of 0.18%), Subsaharan African (13.7%, a difference of 0.21%), Immigrants from Guatemala (13.8%, a difference of 0.25%), and Guatemalan (13.8%, a difference of 0.29%).
| Demographics | Rating | Rank | Single Male Poverty |
| Spanish | 1.0 /100 | #249 | Tragic 13.6% |
| Immigrants | Somalia | 1.0 /100 | #250 | Tragic 13.6% |
| Immigrants | Zaire | 0.9 /100 | #251 | Tragic 13.6% |
| Finns | 0.9 /100 | #252 | Tragic 13.6% |
| German Russians | 0.8 /100 | #253 | Tragic 13.6% |
| Sub-Saharan Africans | 0.5 /100 | #254 | Tragic 13.7% |
| Spaniards | 0.4 /100 | #255 | Tragic 13.7% |
| Immigrants | Belize | 0.4 /100 | #256 | Tragic 13.7% |
| Immigrants | Central America | 0.3 /100 | #257 | Tragic 13.8% |
| Immigrants | Guatemala | 0.3 /100 | #258 | Tragic 13.8% |
| Guatemalans | 0.3 /100 | #259 | Tragic 13.8% |
| Swiss | 0.3 /100 | #260 | Tragic 13.8% |
| Hungarians | 0.3 /100 | #261 | Tragic 13.8% |
| Fijians | 0.3 /100 | #262 | Tragic 13.8% |
| Cape Verdeans | 0.2 /100 | #263 | Tragic 13.8% |