Slovak vs Bulgarian Single Male Poverty
COMPARE
Slovak
Bulgarian
Single Male Poverty
Single Male Poverty Comparison
Slovaks
Bulgarians
14.1%
SINGLE MALE POVERTY
0.0/ 100
METRIC RATING
278th/ 347
METRIC RANK
11.7%
SINGLE MALE POVERTY
99.9/ 100
METRIC RATING
53rd/ 347
METRIC RANK
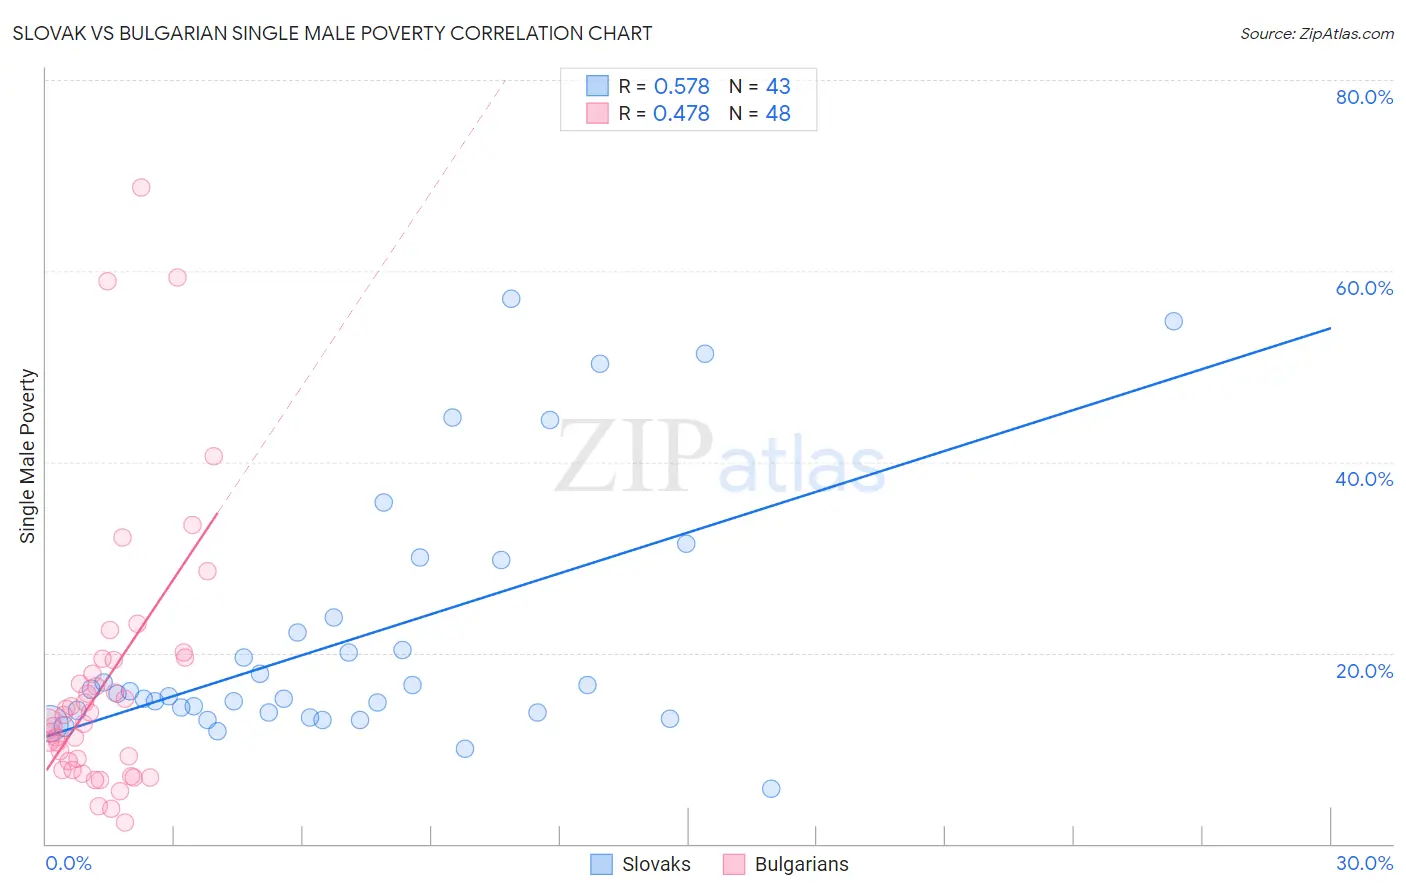
Slovak vs Bulgarian Single Male Poverty Correlation Chart
The statistical analysis conducted on geographies consisting of 343,124,767 people shows a substantial positive correlation between the proportion of Slovaks and poverty level among single males in the United States with a correlation coefficient (R) of 0.578 and weighted average of 14.1%. Similarly, the statistical analysis conducted on geographies consisting of 188,709,586 people shows a moderate positive correlation between the proportion of Bulgarians and poverty level among single males in the United States with a correlation coefficient (R) of 0.478 and weighted average of 11.7%, a difference of 20.8%.
Single Male Poverty Correlation Summary
| Measurement | Slovak | Bulgarian |
| Minimum | 5.7% | 2.3% |
| Maximum | 57.1% | 68.8% |
| Range | 51.4% | 66.5% |
| Mean | 21.6% | 17.0% |
| Median | 15.7% | 13.1% |
| Interquartile 25% (IQ1) | 13.8% | 8.2% |
| Interquartile 75% (IQ3) | 23.6% | 19.3% |
| Interquartile Range (IQR) | 9.9% | 11.1% |
| Standard Deviation (Sample) | 13.2% | 14.2% |
| Standard Deviation (Population) | 13.0% | 14.1% |
Similar Demographics by Single Male Poverty
Demographics Similar to Slovaks by Single Male Poverty
In terms of single male poverty, the demographic groups most similar to Slovaks are Indonesian (14.1%, a difference of 0.040%), Immigrants from Honduras (14.1%, a difference of 0.060%), Dutch (14.1%, a difference of 0.10%), English (14.1%, a difference of 0.22%), and Honduran (14.0%, a difference of 0.30%).
| Demographics | Rating | Rank | Single Male Poverty |
| Irish | 0.1 /100 | #271 | Tragic 14.0% |
| Mexicans | 0.1 /100 | #272 | Tragic 14.0% |
| Welsh | 0.1 /100 | #273 | Tragic 14.0% |
| Hondurans | 0.1 /100 | #274 | Tragic 14.0% |
| English | 0.1 /100 | #275 | Tragic 14.1% |
| Dutch | 0.1 /100 | #276 | Tragic 14.1% |
| Immigrants | Honduras | 0.0 /100 | #277 | Tragic 14.1% |
| Slovaks | 0.0 /100 | #278 | Tragic 14.1% |
| Indonesians | 0.0 /100 | #279 | Tragic 14.1% |
| Hmong | 0.0 /100 | #280 | Tragic 14.2% |
| Hispanics or Latinos | 0.0 /100 | #281 | Tragic 14.2% |
| Spanish Americans | 0.0 /100 | #282 | Tragic 14.2% |
| Yaqui | 0.0 /100 | #283 | Tragic 14.2% |
| Immigrants | Bahamas | 0.0 /100 | #284 | Tragic 14.4% |
| French | 0.0 /100 | #285 | Tragic 14.4% |
Demographics Similar to Bulgarians by Single Male Poverty
In terms of single male poverty, the demographic groups most similar to Bulgarians are Immigrants from Uzbekistan (11.7%, a difference of 0.020%), Samoan (11.7%, a difference of 0.10%), Cypriot (11.7%, a difference of 0.19%), Paraguayan (11.6%, a difference of 0.41%), and Burmese (11.7%, a difference of 0.51%).
| Demographics | Rating | Rank | Single Male Poverty |
| Immigrants | Bulgaria | 99.9 /100 | #46 | Exceptional 11.6% |
| Nepalese | 99.9 /100 | #47 | Exceptional 11.6% |
| Immigrants | Indonesia | 99.9 /100 | #48 | Exceptional 11.6% |
| Tlingit-Haida | 99.9 /100 | #49 | Exceptional 11.6% |
| Immigrants | Lithuania | 99.9 /100 | #50 | Exceptional 11.6% |
| Paraguayans | 99.9 /100 | #51 | Exceptional 11.6% |
| Samoans | 99.9 /100 | #52 | Exceptional 11.7% |
| Bulgarians | 99.9 /100 | #53 | Exceptional 11.7% |
| Immigrants | Uzbekistan | 99.9 /100 | #54 | Exceptional 11.7% |
| Cypriots | 99.9 /100 | #55 | Exceptional 11.7% |
| Burmese | 99.8 /100 | #56 | Exceptional 11.7% |
| Immigrants | Romania | 99.8 /100 | #57 | Exceptional 11.7% |
| Immigrants | Brazil | 99.8 /100 | #58 | Exceptional 11.7% |
| Brazilians | 99.8 /100 | #59 | Exceptional 11.8% |
| Peruvians | 99.8 /100 | #60 | Exceptional 11.8% |