Slovak vs Ugandan Single Male Poverty
COMPARE
Slovak
Ugandan
Single Male Poverty
Single Male Poverty Comparison
Slovaks
Ugandans
14.1%
SINGLE MALE POVERTY
0.0/ 100
METRIC RATING
278th/ 347
METRIC RANK
12.3%
SINGLE MALE POVERTY
94.5/ 100
METRIC RATING
109th/ 347
METRIC RANK
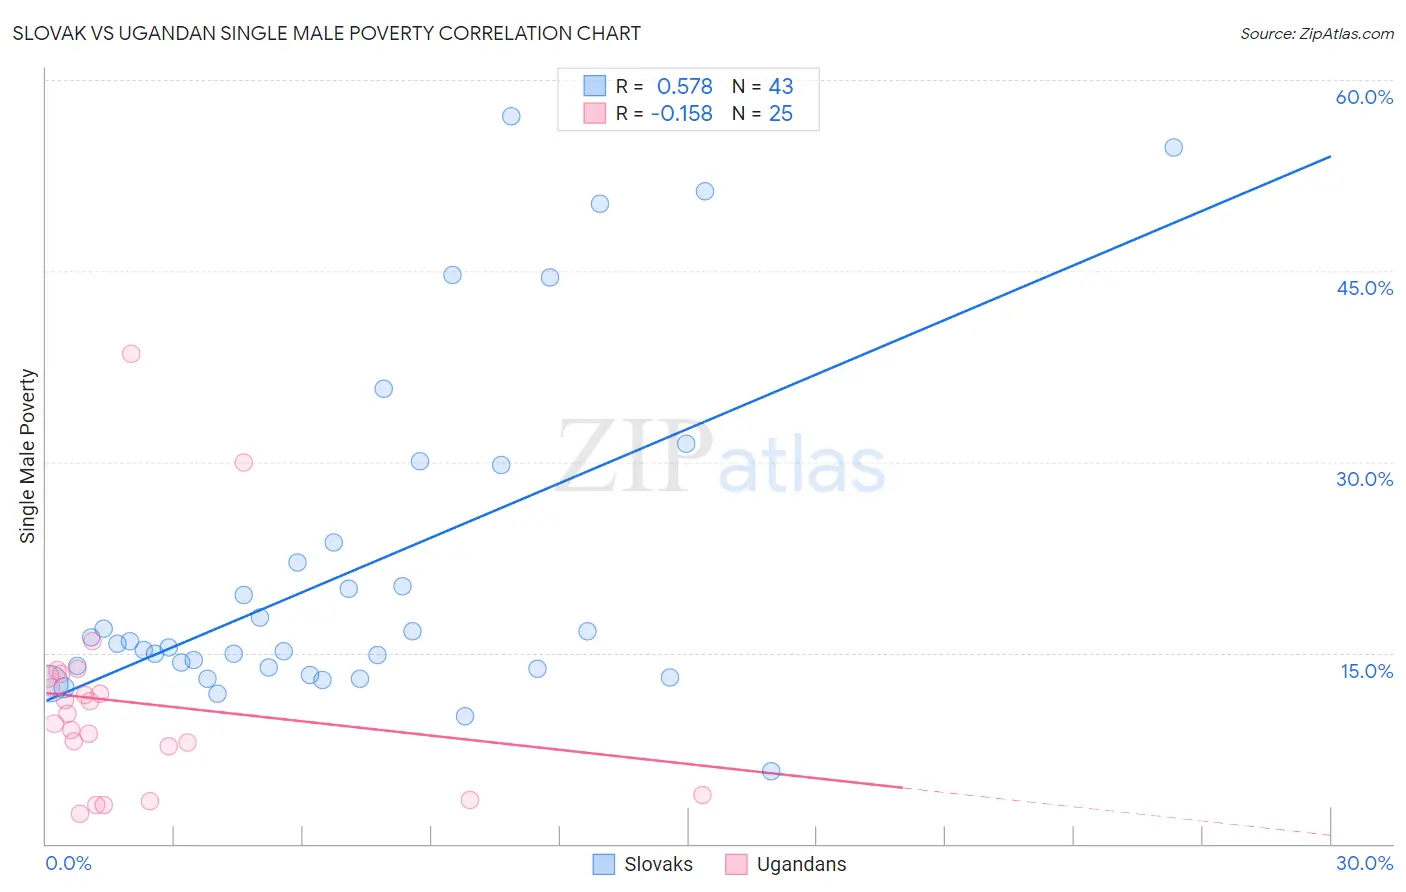
Slovak vs Ugandan Single Male Poverty Correlation Chart
The statistical analysis conducted on geographies consisting of 343,124,767 people shows a substantial positive correlation between the proportion of Slovaks and poverty level among single males in the United States with a correlation coefficient (R) of 0.578 and weighted average of 14.1%. Similarly, the statistical analysis conducted on geographies consisting of 90,762,990 people shows a poor negative correlation between the proportion of Ugandans and poverty level among single males in the United States with a correlation coefficient (R) of -0.158 and weighted average of 12.3%, a difference of 14.4%.
Single Male Poverty Correlation Summary
| Measurement | Slovak | Ugandan |
| Minimum | 5.7% | 2.3% |
| Maximum | 57.1% | 38.5% |
| Range | 51.4% | 36.1% |
| Mean | 21.6% | 11.1% |
| Median | 15.7% | 10.2% |
| Interquartile 25% (IQ1) | 13.8% | 5.7% |
| Interquartile 75% (IQ3) | 23.6% | 13.3% |
| Interquartile Range (IQR) | 9.9% | 7.5% |
| Standard Deviation (Sample) | 13.2% | 8.1% |
| Standard Deviation (Population) | 13.0% | 7.9% |
Similar Demographics by Single Male Poverty
Demographics Similar to Slovaks by Single Male Poverty
In terms of single male poverty, the demographic groups most similar to Slovaks are Indonesian (14.1%, a difference of 0.040%), Immigrants from Honduras (14.1%, a difference of 0.060%), Dutch (14.1%, a difference of 0.10%), English (14.1%, a difference of 0.22%), and Honduran (14.0%, a difference of 0.30%).
| Demographics | Rating | Rank | Single Male Poverty |
| Irish | 0.1 /100 | #271 | Tragic 14.0% |
| Mexicans | 0.1 /100 | #272 | Tragic 14.0% |
| Welsh | 0.1 /100 | #273 | Tragic 14.0% |
| Hondurans | 0.1 /100 | #274 | Tragic 14.0% |
| English | 0.1 /100 | #275 | Tragic 14.1% |
| Dutch | 0.1 /100 | #276 | Tragic 14.1% |
| Immigrants | Honduras | 0.0 /100 | #277 | Tragic 14.1% |
| Slovaks | 0.0 /100 | #278 | Tragic 14.1% |
| Indonesians | 0.0 /100 | #279 | Tragic 14.1% |
| Hmong | 0.0 /100 | #280 | Tragic 14.2% |
| Hispanics or Latinos | 0.0 /100 | #281 | Tragic 14.2% |
| Spanish Americans | 0.0 /100 | #282 | Tragic 14.2% |
| Yaqui | 0.0 /100 | #283 | Tragic 14.2% |
| Immigrants | Bahamas | 0.0 /100 | #284 | Tragic 14.4% |
| French | 0.0 /100 | #285 | Tragic 14.4% |
Demographics Similar to Ugandans by Single Male Poverty
In terms of single male poverty, the demographic groups most similar to Ugandans are Immigrants from Eastern Africa (12.3%, a difference of 0.13%), Iraqi (12.3%, a difference of 0.15%), Immigrants from Portugal (12.3%, a difference of 0.23%), Immigrants from North Macedonia (12.3%, a difference of 0.24%), and Kenyan (12.4%, a difference of 0.30%).
| Demographics | Rating | Rank | Single Male Poverty |
| Immigrants | Europe | 97.0 /100 | #102 | Exceptional 12.2% |
| Immigrants | Armenia | 96.7 /100 | #103 | Exceptional 12.2% |
| Immigrants | Kazakhstan | 96.7 /100 | #104 | Exceptional 12.2% |
| Jordanians | 95.9 /100 | #105 | Exceptional 12.3% |
| Immigrants | Morocco | 95.6 /100 | #106 | Exceptional 12.3% |
| Iraqis | 95.1 /100 | #107 | Exceptional 12.3% |
| Immigrants | Eastern Africa | 95.0 /100 | #108 | Exceptional 12.3% |
| Ugandans | 94.5 /100 | #109 | Exceptional 12.3% |
| Immigrants | Portugal | 93.6 /100 | #110 | Exceptional 12.3% |
| Immigrants | North Macedonia | 93.6 /100 | #111 | Exceptional 12.3% |
| Kenyans | 93.3 /100 | #112 | Exceptional 12.4% |
| Pakistanis | 92.4 /100 | #113 | Exceptional 12.4% |
| Nicaraguans | 92.1 /100 | #114 | Exceptional 12.4% |
| Immigrants | Southern Europe | 91.5 /100 | #115 | Exceptional 12.4% |
| Immigrants | Syria | 91.2 /100 | #116 | Exceptional 12.4% |