Shoshone vs Yugoslavian Family Poverty
COMPARE
Shoshone
Yugoslavian
Family Poverty
Family Poverty Comparison
Shoshone
Yugoslavians
10.9%
FAMILY POVERTY
0.2/ 100
METRIC RATING
261st/ 347
METRIC RANK
8.5%
FAMILY POVERTY
83.5/ 100
METRIC RATING
142nd/ 347
METRIC RANK
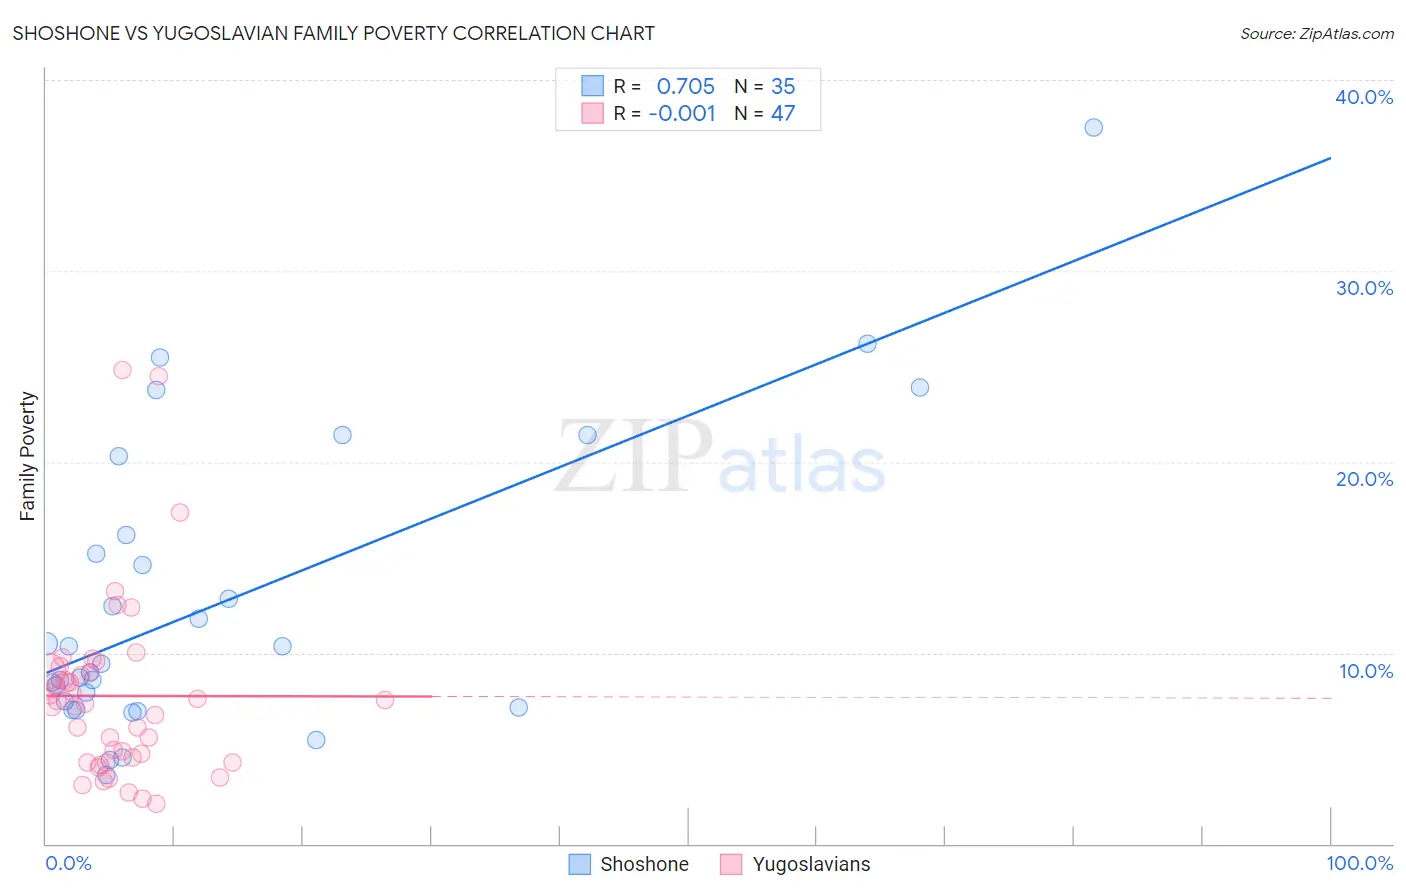
Shoshone vs Yugoslavian Family Poverty Correlation Chart
The statistical analysis conducted on geographies consisting of 66,600,445 people shows a strong positive correlation between the proportion of Shoshone and poverty level among families in the United States with a correlation coefficient (R) of 0.705 and weighted average of 10.9%. Similarly, the statistical analysis conducted on geographies consisting of 285,303,830 people shows no correlation between the proportion of Yugoslavians and poverty level among families in the United States with a correlation coefficient (R) of -0.001 and weighted average of 8.5%, a difference of 27.8%.
Family Poverty Correlation Summary
| Measurement | Shoshone | Yugoslavian |
| Minimum | 3.6% | 2.1% |
| Maximum | 37.5% | 24.8% |
| Range | 33.9% | 22.7% |
| Mean | 12.7% | 7.7% |
| Median | 9.4% | 7.3% |
| Interquartile 25% (IQ1) | 7.1% | 4.3% |
| Interquartile 75% (IQ3) | 16.2% | 9.0% |
| Interquartile Range (IQR) | 9.0% | 4.8% |
| Standard Deviation (Sample) | 7.8% | 4.8% |
| Standard Deviation (Population) | 7.7% | 4.7% |
Similar Demographics by Family Poverty
Demographics Similar to Shoshone by Family Poverty
In terms of family poverty, the demographic groups most similar to Shoshone are Bangladeshi (10.9%, a difference of 0.030%), Spanish American Indian (10.9%, a difference of 0.13%), Mexican American Indian (10.9%, a difference of 0.38%), Cape Verdean (10.9%, a difference of 0.39%), and Trinidadian and Tobagonian (10.9%, a difference of 0.41%).
| Demographics | Rating | Rank | Family Poverty |
| Ecuadorians | 0.2 /100 | #254 | Tragic 10.8% |
| Immigrants | Liberia | 0.2 /100 | #255 | Tragic 10.8% |
| Chickasaw | 0.2 /100 | #256 | Tragic 10.8% |
| Immigrants | Ghana | 0.2 /100 | #257 | Tragic 10.8% |
| Sub-Saharan Africans | 0.2 /100 | #258 | Tragic 10.9% |
| Mexican American Indians | 0.2 /100 | #259 | Tragic 10.9% |
| Bangladeshis | 0.2 /100 | #260 | Tragic 10.9% |
| Shoshone | 0.2 /100 | #261 | Tragic 10.9% |
| Spanish American Indians | 0.2 /100 | #262 | Tragic 10.9% |
| Cape Verdeans | 0.1 /100 | #263 | Tragic 10.9% |
| Trinidadians and Tobagonians | 0.1 /100 | #264 | Tragic 10.9% |
| Immigrants | Trinidad and Tobago | 0.1 /100 | #265 | Tragic 10.9% |
| Immigrants | El Salvador | 0.1 /100 | #266 | Tragic 11.0% |
| Comanche | 0.1 /100 | #267 | Tragic 11.0% |
| Jamaicans | 0.1 /100 | #268 | Tragic 11.1% |
Demographics Similar to Yugoslavians by Family Poverty
In terms of family poverty, the demographic groups most similar to Yugoslavians are Immigrants from Germany (8.5%, a difference of 0.030%), Albanian (8.5%, a difference of 0.050%), Immigrants from South Eastern Asia (8.5%, a difference of 0.070%), Immigrants from Belarus (8.5%, a difference of 0.080%), and Immigrants from Ukraine (8.5%, a difference of 0.11%).
| Demographics | Rating | Rank | Family Poverty |
| Immigrants | Malaysia | 86.5 /100 | #135 | Excellent 8.5% |
| Immigrants | Brazil | 86.3 /100 | #136 | Excellent 8.5% |
| Immigrants | Southern Europe | 86.0 /100 | #137 | Excellent 8.5% |
| Armenians | 84.6 /100 | #138 | Excellent 8.5% |
| Immigrants | Nepal | 84.2 /100 | #139 | Excellent 8.5% |
| Immigrants | Kazakhstan | 84.1 /100 | #140 | Excellent 8.5% |
| Immigrants | Ukraine | 83.9 /100 | #141 | Excellent 8.5% |
| Yugoslavians | 83.5 /100 | #142 | Excellent 8.5% |
| Immigrants | Germany | 83.3 /100 | #143 | Excellent 8.5% |
| Albanians | 83.3 /100 | #144 | Excellent 8.5% |
| Immigrants | South Eastern Asia | 83.2 /100 | #145 | Excellent 8.5% |
| Immigrants | Belarus | 83.2 /100 | #146 | Excellent 8.5% |
| Immigrants | Jordan | 83.0 /100 | #147 | Excellent 8.5% |
| Scotch-Irish | 82.2 /100 | #148 | Excellent 8.6% |
| Mongolians | 80.4 /100 | #149 | Excellent 8.6% |