Shoshone vs Immigrants from Eastern Asia Family Poverty
COMPARE
Shoshone
Immigrants from Eastern Asia
Family Poverty
Family Poverty Comparison
Shoshone
Immigrants from Eastern Asia
10.9%
FAMILY POVERTY
0.2/ 100
METRIC RATING
261st/ 347
METRIC RANK
7.7%
FAMILY POVERTY
98.7/ 100
METRIC RATING
55th/ 347
METRIC RANK
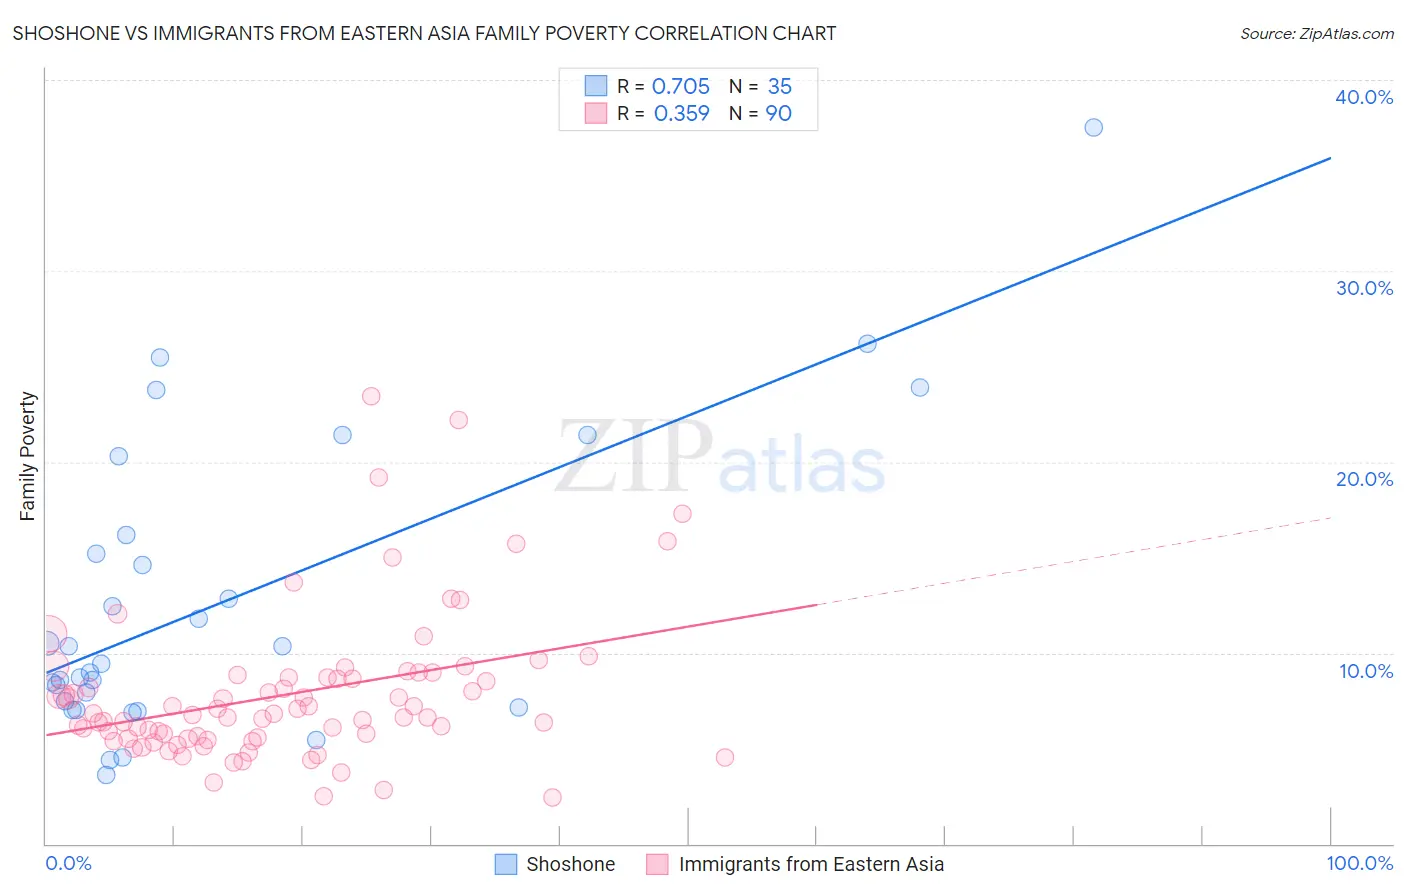
Shoshone vs Immigrants from Eastern Asia Family Poverty Correlation Chart
The statistical analysis conducted on geographies consisting of 66,600,445 people shows a strong positive correlation between the proportion of Shoshone and poverty level among families in the United States with a correlation coefficient (R) of 0.705 and weighted average of 10.9%. Similarly, the statistical analysis conducted on geographies consisting of 497,339,413 people shows a mild positive correlation between the proportion of Immigrants from Eastern Asia and poverty level among families in the United States with a correlation coefficient (R) of 0.359 and weighted average of 7.7%, a difference of 41.2%.
Family Poverty Correlation Summary
| Measurement | Shoshone | Immigrants from Eastern Asia |
| Minimum | 3.6% | 2.4% |
| Maximum | 37.5% | 23.4% |
| Range | 33.9% | 21.0% |
| Mean | 12.7% | 7.8% |
| Median | 9.4% | 6.8% |
| Interquartile 25% (IQ1) | 7.1% | 5.5% |
| Interquartile 75% (IQ3) | 16.2% | 8.7% |
| Interquartile Range (IQR) | 9.0% | 3.2% |
| Standard Deviation (Sample) | 7.8% | 3.9% |
| Standard Deviation (Population) | 7.7% | 3.8% |
Similar Demographics by Family Poverty
Demographics Similar to Shoshone by Family Poverty
In terms of family poverty, the demographic groups most similar to Shoshone are Bangladeshi (10.9%, a difference of 0.030%), Spanish American Indian (10.9%, a difference of 0.13%), Mexican American Indian (10.9%, a difference of 0.38%), Cape Verdean (10.9%, a difference of 0.39%), and Trinidadian and Tobagonian (10.9%, a difference of 0.41%).
| Demographics | Rating | Rank | Family Poverty |
| Ecuadorians | 0.2 /100 | #254 | Tragic 10.8% |
| Immigrants | Liberia | 0.2 /100 | #255 | Tragic 10.8% |
| Chickasaw | 0.2 /100 | #256 | Tragic 10.8% |
| Immigrants | Ghana | 0.2 /100 | #257 | Tragic 10.8% |
| Sub-Saharan Africans | 0.2 /100 | #258 | Tragic 10.9% |
| Mexican American Indians | 0.2 /100 | #259 | Tragic 10.9% |
| Bangladeshis | 0.2 /100 | #260 | Tragic 10.9% |
| Shoshone | 0.2 /100 | #261 | Tragic 10.9% |
| Spanish American Indians | 0.2 /100 | #262 | Tragic 10.9% |
| Cape Verdeans | 0.1 /100 | #263 | Tragic 10.9% |
| Trinidadians and Tobagonians | 0.1 /100 | #264 | Tragic 10.9% |
| Immigrants | Trinidad and Tobago | 0.1 /100 | #265 | Tragic 10.9% |
| Immigrants | El Salvador | 0.1 /100 | #266 | Tragic 11.0% |
| Comanche | 0.1 /100 | #267 | Tragic 11.0% |
| Jamaicans | 0.1 /100 | #268 | Tragic 11.1% |
Demographics Similar to Immigrants from Eastern Asia by Family Poverty
In terms of family poverty, the demographic groups most similar to Immigrants from Eastern Asia are Immigrants from Sweden (7.7%, a difference of 0.030%), Swiss (7.7%, a difference of 0.040%), Immigrants from Serbia (7.7%, a difference of 0.040%), Indian (Asian) (7.7%, a difference of 0.10%), and Asian (7.7%, a difference of 0.13%).
| Demographics | Rating | Rank | Family Poverty |
| Immigrants | Sri Lanka | 98.9 /100 | #48 | Exceptional 7.7% |
| Immigrants | Bolivia | 98.9 /100 | #49 | Exceptional 7.7% |
| Immigrants | North Macedonia | 98.9 /100 | #50 | Exceptional 7.7% |
| Immigrants | Moldova | 98.8 /100 | #51 | Exceptional 7.7% |
| Indians (Asian) | 98.8 /100 | #52 | Exceptional 7.7% |
| Swiss | 98.8 /100 | #53 | Exceptional 7.7% |
| Immigrants | Sweden | 98.8 /100 | #54 | Exceptional 7.7% |
| Immigrants | Eastern Asia | 98.7 /100 | #55 | Exceptional 7.7% |
| Immigrants | Serbia | 98.7 /100 | #56 | Exceptional 7.7% |
| Asians | 98.7 /100 | #57 | Exceptional 7.7% |
| Finns | 98.7 /100 | #58 | Exceptional 7.7% |
| Europeans | 98.7 /100 | #59 | Exceptional 7.7% |
| Immigrants | Greece | 98.7 /100 | #60 | Exceptional 7.7% |
| Immigrants | Netherlands | 98.6 /100 | #61 | Exceptional 7.7% |
| Macedonians | 98.6 /100 | #62 | Exceptional 7.8% |