Shoshone vs Immigrants from Eritrea Single Male Poverty
COMPARE
Shoshone
Immigrants from Eritrea
Single Male Poverty
Single Male Poverty Comparison
Shoshone
Immigrants from Eritrea
16.7%
SINGLE MALE POVERTY
0.0/ 100
METRIC RATING
322nd/ 347
METRIC RANK
12.1%
SINGLE MALE POVERTY
98.5/ 100
METRIC RATING
88th/ 347
METRIC RANK
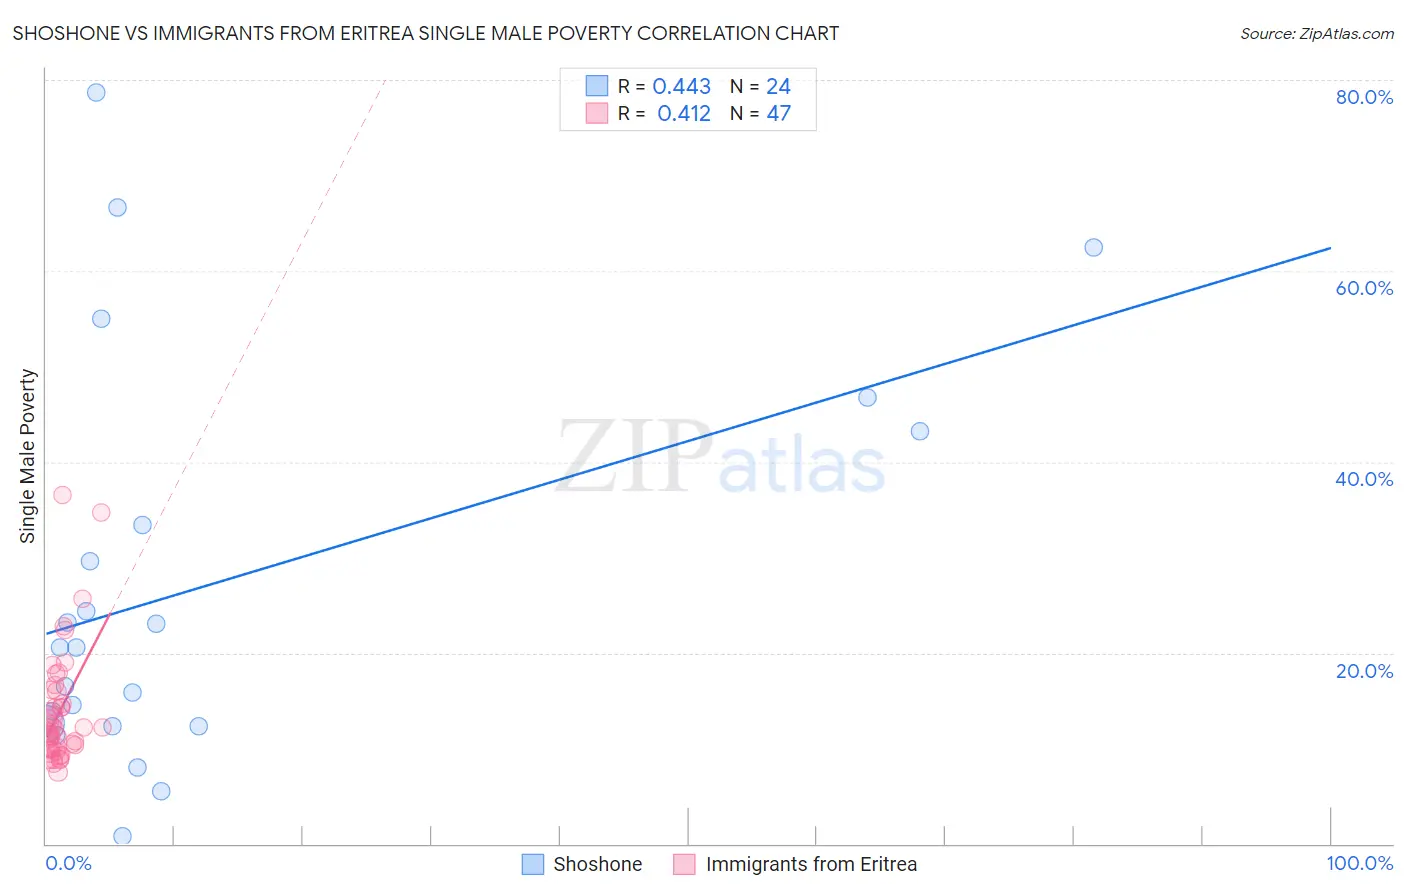
Shoshone vs Immigrants from Eritrea Single Male Poverty Correlation Chart
The statistical analysis conducted on geographies consisting of 64,727,315 people shows a moderate positive correlation between the proportion of Shoshone and poverty level among single males in the United States with a correlation coefficient (R) of 0.443 and weighted average of 16.7%. Similarly, the statistical analysis conducted on geographies consisting of 101,335,680 people shows a moderate positive correlation between the proportion of Immigrants from Eritrea and poverty level among single males in the United States with a correlation coefficient (R) of 0.412 and weighted average of 12.1%, a difference of 37.8%.
Single Male Poverty Correlation Summary
| Measurement | Shoshone | Immigrants from Eritrea |
| Minimum | 0.78% | 7.5% |
| Maximum | 78.7% | 36.5% |
| Range | 77.9% | 29.0% |
| Mean | 27.1% | 13.9% |
| Median | 20.6% | 12.1% |
| Interquartile 25% (IQ1) | 12.4% | 10.0% |
| Interquartile 75% (IQ3) | 38.3% | 16.0% |
| Interquartile Range (IQR) | 25.9% | 6.0% |
| Standard Deviation (Sample) | 20.9% | 6.1% |
| Standard Deviation (Population) | 20.5% | 6.1% |
Similar Demographics by Single Male Poverty
Demographics Similar to Shoshone by Single Male Poverty
In terms of single male poverty, the demographic groups most similar to Shoshone are Creek (16.8%, a difference of 1.0%), Immigrants from Yemen (16.9%, a difference of 1.1%), Osage (16.5%, a difference of 1.3%), Marshallese (16.4%, a difference of 1.4%), and Chippewa (16.4%, a difference of 1.9%).
| Demographics | Rating | Rank | Single Male Poverty |
| Cheyenne | 0.0 /100 | #315 | Tragic 16.1% |
| Dutch West Indians | 0.0 /100 | #316 | Tragic 16.1% |
| Blacks/African Americans | 0.0 /100 | #317 | Tragic 16.2% |
| Chickasaw | 0.0 /100 | #318 | Tragic 16.3% |
| Chippewa | 0.0 /100 | #319 | Tragic 16.4% |
| Marshallese | 0.0 /100 | #320 | Tragic 16.4% |
| Osage | 0.0 /100 | #321 | Tragic 16.5% |
| Shoshone | 0.0 /100 | #322 | Tragic 16.7% |
| Creek | 0.0 /100 | #323 | Tragic 16.8% |
| Immigrants | Yemen | 0.0 /100 | #324 | Tragic 16.9% |
| Choctaw | 0.0 /100 | #325 | Tragic 17.0% |
| Central American Indians | 0.0 /100 | #326 | Tragic 17.2% |
| Menominee | 0.0 /100 | #327 | Tragic 17.7% |
| Kiowa | 0.0 /100 | #328 | Tragic 18.3% |
| Colville | 0.0 /100 | #329 | Tragic 18.4% |
Demographics Similar to Immigrants from Eritrea by Single Male Poverty
In terms of single male poverty, the demographic groups most similar to Immigrants from Eritrea are South American (12.1%, a difference of 0.0%), Immigrants from Israel (12.1%, a difference of 0.020%), Turkish (12.1%, a difference of 0.040%), Immigrants from Czechoslovakia (12.1%, a difference of 0.11%), and Immigrants from Colombia (12.1%, a difference of 0.14%).
| Demographics | Rating | Rank | Single Male Poverty |
| Immigrants | South America | 98.7 /100 | #81 | Exceptional 12.1% |
| Immigrants | Colombia | 98.6 /100 | #82 | Exceptional 12.1% |
| Immigrants | Chile | 98.6 /100 | #83 | Exceptional 12.1% |
| Immigrants | Czechoslovakia | 98.6 /100 | #84 | Exceptional 12.1% |
| Turks | 98.5 /100 | #85 | Exceptional 12.1% |
| Immigrants | Israel | 98.5 /100 | #86 | Exceptional 12.1% |
| South Americans | 98.5 /100 | #87 | Exceptional 12.1% |
| Immigrants | Eritrea | 98.5 /100 | #88 | Exceptional 12.1% |
| Immigrants | Ireland | 98.3 /100 | #89 | Exceptional 12.1% |
| South American Indians | 98.3 /100 | #90 | Exceptional 12.1% |
| Immigrants | Turkey | 98.2 /100 | #91 | Exceptional 12.1% |
| Spanish American Indians | 98.0 /100 | #92 | Exceptional 12.1% |
| Immigrants | Bosnia and Herzegovina | 97.9 /100 | #93 | Exceptional 12.1% |
| Colombians | 97.8 /100 | #94 | Exceptional 12.2% |
| Mongolians | 97.7 /100 | #95 | Exceptional 12.2% |