Shoshone vs Immigrants from Iran Single Male Poverty
COMPARE
Shoshone
Immigrants from Iran
Single Male Poverty
Single Male Poverty Comparison
Shoshone
Immigrants from Iran
16.7%
SINGLE MALE POVERTY
0.0/ 100
METRIC RATING
322nd/ 347
METRIC RANK
11.4%
SINGLE MALE POVERTY
100.0/ 100
METRIC RATING
31st/ 347
METRIC RANK
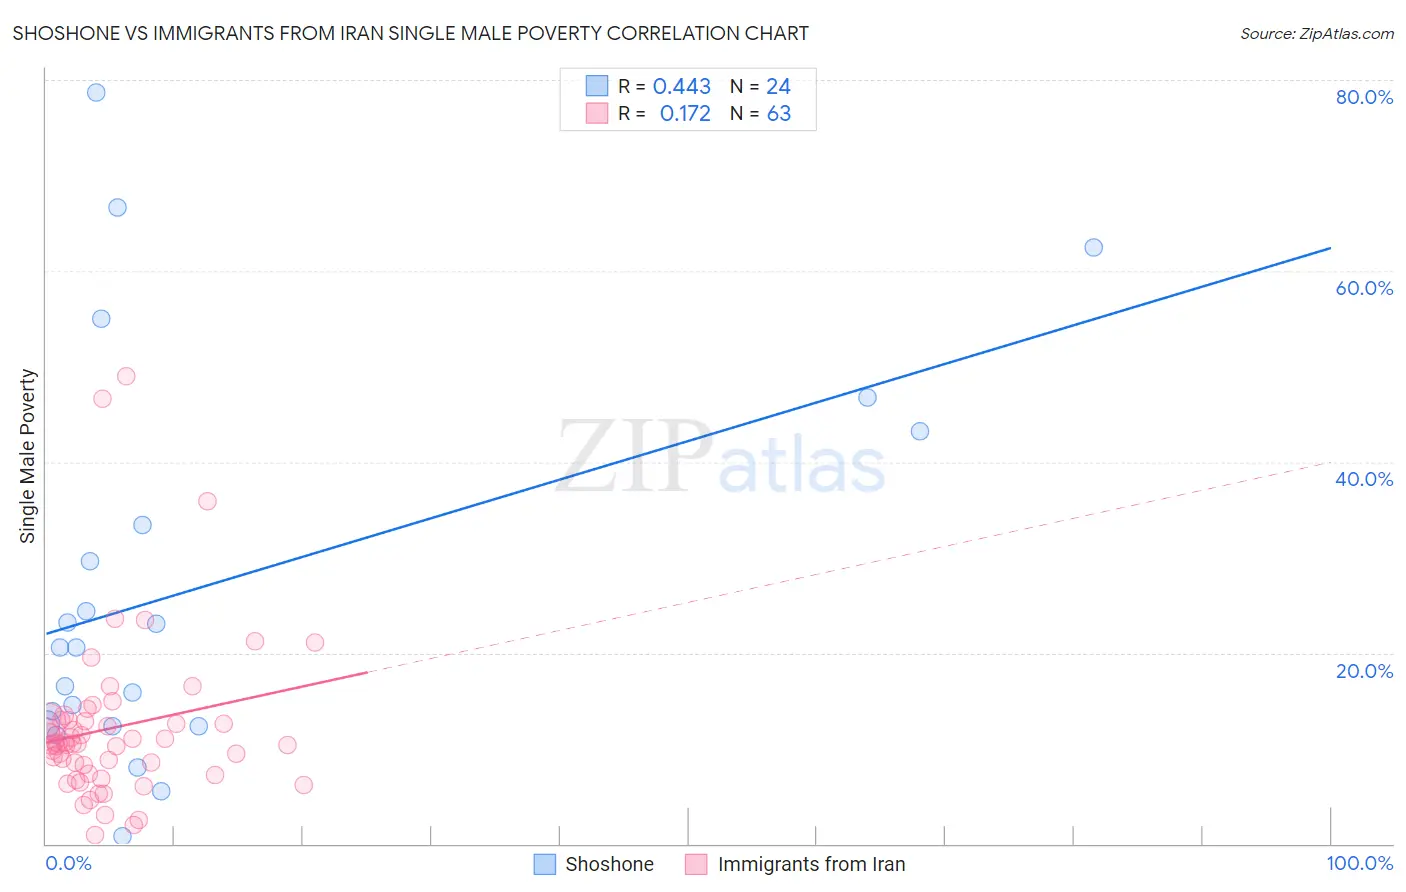
Shoshone vs Immigrants from Iran Single Male Poverty Correlation Chart
The statistical analysis conducted on geographies consisting of 64,727,315 people shows a moderate positive correlation between the proportion of Shoshone and poverty level among single males in the United States with a correlation coefficient (R) of 0.443 and weighted average of 16.7%. Similarly, the statistical analysis conducted on geographies consisting of 253,206,920 people shows a poor positive correlation between the proportion of Immigrants from Iran and poverty level among single males in the United States with a correlation coefficient (R) of 0.172 and weighted average of 11.4%, a difference of 46.1%.
Single Male Poverty Correlation Summary
| Measurement | Shoshone | Immigrants from Iran |
| Minimum | 0.78% | 0.97% |
| Maximum | 78.7% | 49.0% |
| Range | 77.9% | 48.0% |
| Mean | 27.1% | 12.1% |
| Median | 20.6% | 10.5% |
| Interquartile 25% (IQ1) | 12.4% | 7.4% |
| Interquartile 75% (IQ3) | 38.3% | 12.9% |
| Interquartile Range (IQR) | 25.9% | 5.6% |
| Standard Deviation (Sample) | 20.9% | 8.7% |
| Standard Deviation (Population) | 20.5% | 8.6% |
Similar Demographics by Single Male Poverty
Demographics Similar to Shoshone by Single Male Poverty
In terms of single male poverty, the demographic groups most similar to Shoshone are Creek (16.8%, a difference of 1.0%), Immigrants from Yemen (16.9%, a difference of 1.1%), Osage (16.5%, a difference of 1.3%), Marshallese (16.4%, a difference of 1.4%), and Chippewa (16.4%, a difference of 1.9%).
| Demographics | Rating | Rank | Single Male Poverty |
| Cheyenne | 0.0 /100 | #315 | Tragic 16.1% |
| Dutch West Indians | 0.0 /100 | #316 | Tragic 16.1% |
| Blacks/African Americans | 0.0 /100 | #317 | Tragic 16.2% |
| Chickasaw | 0.0 /100 | #318 | Tragic 16.3% |
| Chippewa | 0.0 /100 | #319 | Tragic 16.4% |
| Marshallese | 0.0 /100 | #320 | Tragic 16.4% |
| Osage | 0.0 /100 | #321 | Tragic 16.5% |
| Shoshone | 0.0 /100 | #322 | Tragic 16.7% |
| Creek | 0.0 /100 | #323 | Tragic 16.8% |
| Immigrants | Yemen | 0.0 /100 | #324 | Tragic 16.9% |
| Choctaw | 0.0 /100 | #325 | Tragic 17.0% |
| Central American Indians | 0.0 /100 | #326 | Tragic 17.2% |
| Menominee | 0.0 /100 | #327 | Tragic 17.7% |
| Kiowa | 0.0 /100 | #328 | Tragic 18.3% |
| Colville | 0.0 /100 | #329 | Tragic 18.4% |
Demographics Similar to Immigrants from Iran by Single Male Poverty
In terms of single male poverty, the demographic groups most similar to Immigrants from Iran are Iranian (11.4%, a difference of 0.090%), Immigrants from Eastern Asia (11.4%, a difference of 0.090%), Immigrants from Egypt (11.4%, a difference of 0.15%), Immigrants from Vietnam (11.4%, a difference of 0.16%), and Immigrants from Ethiopia (11.4%, a difference of 0.20%).
| Demographics | Rating | Rank | Single Male Poverty |
| Indians (Asian) | 100.0 /100 | #24 | Exceptional 11.3% |
| Maltese | 100.0 /100 | #25 | Exceptional 11.3% |
| Immigrants | Japan | 100.0 /100 | #26 | Exceptional 11.3% |
| Immigrants | China | 100.0 /100 | #27 | Exceptional 11.4% |
| Immigrants | Asia | 100.0 /100 | #28 | Exceptional 11.4% |
| Immigrants | Egypt | 100.0 /100 | #29 | Exceptional 11.4% |
| Iranians | 100.0 /100 | #30 | Exceptional 11.4% |
| Immigrants | Iran | 100.0 /100 | #31 | Exceptional 11.4% |
| Immigrants | Eastern Asia | 100.0 /100 | #32 | Exceptional 11.4% |
| Immigrants | Vietnam | 100.0 /100 | #33 | Exceptional 11.4% |
| Immigrants | Ethiopia | 100.0 /100 | #34 | Exceptional 11.4% |
| Immigrants | South Eastern Asia | 100.0 /100 | #35 | Exceptional 11.4% |
| Immigrants | Serbia | 100.0 /100 | #36 | Exceptional 11.4% |
| Immigrants | Singapore | 100.0 /100 | #37 | Exceptional 11.4% |
| Sri Lankans | 100.0 /100 | #38 | Exceptional 11.5% |