Spaniard vs Immigrants from Eritrea Single Male Poverty
COMPARE
Spaniard
Immigrants from Eritrea
Single Male Poverty
Single Male Poverty Comparison
Spaniards
Immigrants from Eritrea
13.7%
SINGLE MALE POVERTY
0.4/ 100
METRIC RATING
255th/ 347
METRIC RANK
12.1%
SINGLE MALE POVERTY
98.5/ 100
METRIC RATING
88th/ 347
METRIC RANK
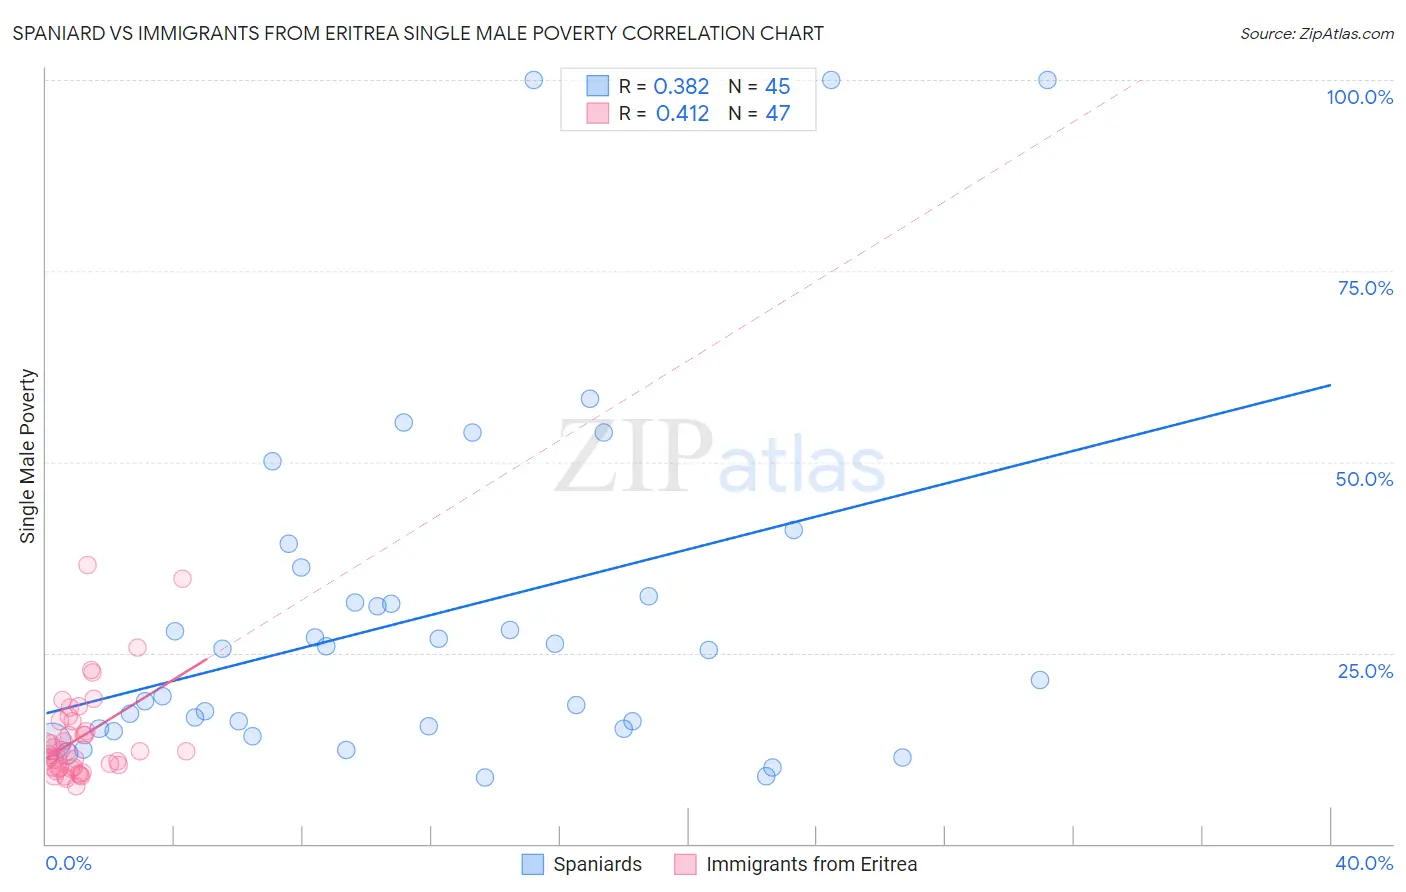
Spaniard vs Immigrants from Eritrea Single Male Poverty Correlation Chart
The statistical analysis conducted on geographies consisting of 390,345,278 people shows a mild positive correlation between the proportion of Spaniards and poverty level among single males in the United States with a correlation coefficient (R) of 0.382 and weighted average of 13.7%. Similarly, the statistical analysis conducted on geographies consisting of 101,335,680 people shows a moderate positive correlation between the proportion of Immigrants from Eritrea and poverty level among single males in the United States with a correlation coefficient (R) of 0.412 and weighted average of 12.1%, a difference of 13.4%.
Single Male Poverty Correlation Summary
| Measurement | Spaniard | Immigrants from Eritrea |
| Minimum | 8.7% | 7.5% |
| Maximum | 100.0% | 36.5% |
| Range | 91.3% | 29.0% |
| Mean | 30.0% | 13.9% |
| Median | 25.4% | 12.1% |
| Interquartile 25% (IQ1) | 15.0% | 10.0% |
| Interquartile 75% (IQ3) | 34.3% | 16.0% |
| Interquartile Range (IQR) | 19.3% | 6.0% |
| Standard Deviation (Sample) | 23.1% | 6.1% |
| Standard Deviation (Population) | 22.8% | 6.1% |
Similar Demographics by Single Male Poverty
Demographics Similar to Spaniards by Single Male Poverty
In terms of single male poverty, the demographic groups most similar to Spaniards are Immigrants from Belize (13.7%, a difference of 0.10%), Subsaharan African (13.7%, a difference of 0.11%), Immigrants from Central America (13.8%, a difference of 0.29%), Immigrants from Guatemala (13.8%, a difference of 0.35%), and Guatemalan (13.8%, a difference of 0.39%).
| Demographics | Rating | Rank | Single Male Poverty |
| Czechs | 1.2 /100 | #248 | Tragic 13.5% |
| Spanish | 1.0 /100 | #249 | Tragic 13.6% |
| Immigrants | Somalia | 1.0 /100 | #250 | Tragic 13.6% |
| Immigrants | Zaire | 0.9 /100 | #251 | Tragic 13.6% |
| Finns | 0.9 /100 | #252 | Tragic 13.6% |
| German Russians | 0.8 /100 | #253 | Tragic 13.6% |
| Sub-Saharan Africans | 0.5 /100 | #254 | Tragic 13.7% |
| Spaniards | 0.4 /100 | #255 | Tragic 13.7% |
| Immigrants | Belize | 0.4 /100 | #256 | Tragic 13.7% |
| Immigrants | Central America | 0.3 /100 | #257 | Tragic 13.8% |
| Immigrants | Guatemala | 0.3 /100 | #258 | Tragic 13.8% |
| Guatemalans | 0.3 /100 | #259 | Tragic 13.8% |
| Swiss | 0.3 /100 | #260 | Tragic 13.8% |
| Hungarians | 0.3 /100 | #261 | Tragic 13.8% |
| Fijians | 0.3 /100 | #262 | Tragic 13.8% |
Demographics Similar to Immigrants from Eritrea by Single Male Poverty
In terms of single male poverty, the demographic groups most similar to Immigrants from Eritrea are South American (12.1%, a difference of 0.0%), Immigrants from Israel (12.1%, a difference of 0.020%), Turkish (12.1%, a difference of 0.040%), Immigrants from Czechoslovakia (12.1%, a difference of 0.11%), and Immigrants from Colombia (12.1%, a difference of 0.14%).
| Demographics | Rating | Rank | Single Male Poverty |
| Immigrants | South America | 98.7 /100 | #81 | Exceptional 12.1% |
| Immigrants | Colombia | 98.6 /100 | #82 | Exceptional 12.1% |
| Immigrants | Chile | 98.6 /100 | #83 | Exceptional 12.1% |
| Immigrants | Czechoslovakia | 98.6 /100 | #84 | Exceptional 12.1% |
| Turks | 98.5 /100 | #85 | Exceptional 12.1% |
| Immigrants | Israel | 98.5 /100 | #86 | Exceptional 12.1% |
| South Americans | 98.5 /100 | #87 | Exceptional 12.1% |
| Immigrants | Eritrea | 98.5 /100 | #88 | Exceptional 12.1% |
| Immigrants | Ireland | 98.3 /100 | #89 | Exceptional 12.1% |
| South American Indians | 98.3 /100 | #90 | Exceptional 12.1% |
| Immigrants | Turkey | 98.2 /100 | #91 | Exceptional 12.1% |
| Spanish American Indians | 98.0 /100 | #92 | Exceptional 12.1% |
| Immigrants | Bosnia and Herzegovina | 97.9 /100 | #93 | Exceptional 12.1% |
| Colombians | 97.8 /100 | #94 | Exceptional 12.2% |
| Mongolians | 97.7 /100 | #95 | Exceptional 12.2% |