Shoshone vs Immigrants from Latin America Single Male Poverty

COMPARE

Shoshone
Race
Ancestry
AfghanAfricanAlaska NativeAlaskan AthabascanAlbanianAleutAlsatianAmericanApacheArabArapahoArgentineanArmenianAssyrian/Chaldean/SyriacAustralianAustrianBahamianBangladeshiBarbadianBasqueBelgianBelizeanBermudanBhutaneseBlackfeetBolivianBrazilianBritishBritish West IndianBulgarianBurmeseCajunCambodianCanadianCape VerdeanCarpatho RusynCelticCentral AmericanCentral American IndianCherokeeCheyenneChickasawChileanChineseChippewaChoctawColombianColvilleComancheCosta RicanCreeCreekCroatianCrowCubanCypriotCzechCzechoslovakianDanishDelawareDominicanDutchDutch West IndianEastern EuropeanEcuadorianEgyptianEnglishEstonianEthiopianEuropeanFijianFilipinoFinnishFrenchFrench American IndianFrench CanadianGermanGerman RussianGhanaianGreekGuamanian/ChamorroGuatemalanGuyaneseHaitianHmongHonduranHopiHoumaHungarianIcelanderIndian (Asian)IndonesianInupiatIranianIraqiIrishIroquoisIsraeliItalianJamaicanJapaneseJordanianKenyanKiowaKoreanLaotianLatvianLebaneseLiberianLithuanianLumbeeLuxembourgerMacedonianMalaysianMalteseMarshalleseMenomineeMexicanMexican American IndianMongolianMoroccanNative HawaiianNavajoNepaleseNew ZealanderNicaraguanNigerianNorthern EuropeanNorwegianOkinawanOsageOttawaPaiutePakistaniPalestinianPanamanianParaguayanPennsylvania GermanPeruvianPimaPolishPortuguesePotawatomiPuebloPuerto RicanPuget Sound SalishRomanianRussianSalvadoranSamoanScandinavianScotch-IrishScottishSeminoleSenegaleseSerbianShoshoneSierra LeoneanSiouxSlavicSlovakSloveneSomaliSouth AfricanSouth AmericanSouth American IndianSoviet UnionSpaniardSpanishSpanish AmericanSpanish American IndianSri LankanSubsaharan AfricanSudaneseSwedishSwissSyrianTaiwaneseThaiTlingit-HaidaTohono O'OdhamTonganTrinidadian and TobagonianTsimshianTurkishU.S. Virgin IslanderUgandanUkrainianUruguayanUteVenezuelanVietnameseWelshWest IndianYakamaYaquiYugoslavianYumanYup'ikZimbabwean
Immigration
NonimmigrantsImmigrantsAfghanistanAfricaAlbaniaArgentinaArmeniaAsiaAustraliaAustriaBahamasBangladeshBarbadosBelarusBelgiumBelizeBoliviaBosnia and HerzegovinaBrazilBulgariaBurma/MyanmarCabo VerdeCambodiaCameroonCanadaCaribbeanCentral AmericaChileChinaColombiaCongoCosta RicaCroatiaCubaCzechoslovakiaDenmarkDominicaDominican RepublicEastern AfricaEastern AsiaEastern EuropeEcuadorEgyptEl SalvadorEnglandEritreaEthiopiaEuropeFijiFranceGermanyGhanaGreeceGrenadaGuatemalaGuyanaHaitiHondurasHong KongHungaryIndiaIndonesiaIranIraqIrelandIsraelItalyJamaicaJapanJordanKazakhstanKenyaKoreaKuwaitLaosLatviaLebanonLiberiaLithuaniaMalaysiaMexicoMicronesiaMiddle AfricaMoldovaMoroccoNepalNetherlandsNicaraguaNigeriaNorth AmericaNorth MacedoniaNorthern AfricaNorthern EuropeNorwayOceaniaPakistanPanamaPeruPhilippinesPolandPortugalRomaniaRussiaSaudi ArabiaScotlandSenegalSerbiaSierra LeoneSingaporeSomaliaSouth AfricaSouth AmericaSouth Central AsiaSouth Eastern AsiaSouthern EuropeSpainSri LankaSt. Vincent and the GrenadinesSudanSwedenSwitzerlandSyriaTaiwanThailandTrinidad and TobagoTurkeyUgandaUkraineUruguayUzbekistanVenezuelaVietnamWest IndiesWestern AfricaWestern AsiaWestern EuropeYemenZaireZimbabweAzores
Immigrants from Latin America
Race
Ancestry
AfghanAfricanAlaska NativeAlaskan AthabascanAlbanianAleutAlsatianAmericanApacheArabArapahoArgentineanArmenianAssyrian/Chaldean/SyriacAustralianAustrianBahamianBangladeshiBarbadianBasqueBelgianBelizeanBermudanBhutaneseBlackfeetBolivianBrazilianBritishBritish West IndianBulgarianBurmeseCajunCambodianCanadianCape VerdeanCarpatho RusynCelticCentral AmericanCentral American IndianCherokeeCheyenneChickasawChileanChineseChippewaChoctawColombianColvilleComancheCosta RicanCreeCreekCroatianCrowCubanCypriotCzechCzechoslovakianDanishDelawareDominicanDutchDutch West IndianEastern EuropeanEcuadorianEgyptianEnglishEstonianEthiopianEuropeanFijianFilipinoFinnishFrenchFrench American IndianFrench CanadianGermanGerman RussianGhanaianGreekGuamanian/ChamorroGuatemalanGuyaneseHaitianHmongHonduranHopiHoumaHungarianIcelanderIndian (Asian)IndonesianInupiatIranianIraqiIrishIroquoisIsraeliItalianJamaicanJapaneseJordanianKenyanKiowaKoreanLaotianLatvianLebaneseLiberianLithuanianLumbeeLuxembourgerMacedonianMalaysianMalteseMarshalleseMenomineeMexicanMexican American IndianMongolianMoroccanNative HawaiianNavajoNepaleseNew ZealanderNicaraguanNigerianNorthern EuropeanNorwegianOkinawanOsageOttawaPaiutePakistaniPalestinianPanamanianParaguayanPennsylvania GermanPeruvianPimaPolishPortuguesePotawatomiPuebloPuerto RicanPuget Sound SalishRomanianRussianSalvadoranSamoanScandinavianScotch-IrishScottishSeminoleSenegaleseSerbianSierra LeoneanSiouxSlavicSlovakSloveneSomaliSouth AfricanSouth AmericanSouth American IndianSoviet UnionSpaniardSpanishSpanish AmericanSpanish American IndianSri LankanSubsaharan AfricanSudaneseSwedishSwissSyrianTaiwaneseThaiTlingit-HaidaTohono O'OdhamTonganTrinidadian and TobagonianTsimshianTurkishU.S. Virgin IslanderUgandanUkrainianUruguayanUteVenezuelanVietnameseWelshWest IndianYakamaYaquiYugoslavianYumanYup'ikZimbabwean
Immigration
NonimmigrantsImmigrantsAfghanistanAfricaAlbaniaArgentinaArmeniaAsiaAustraliaAustriaBahamasBangladeshBarbadosBelarusBelgiumBelizeBoliviaBosnia and HerzegovinaBrazilBulgariaBurma/MyanmarCabo VerdeCambodiaCameroonCanadaCaribbeanCentral AmericaChileChinaColombiaCongoCosta RicaCroatiaCubaCzechoslovakiaDenmarkDominicaDominican RepublicEastern AfricaEastern AsiaEastern EuropeEcuadorEgyptEl SalvadorEnglandEritreaEthiopiaEuropeFijiFranceGermanyGhanaGreeceGrenadaGuatemalaGuyanaHaitiHondurasHong KongHungaryIndiaIndonesiaIranIraqIrelandIsraelItalyJamaicaJapanJordanKazakhstanKenyaKoreaKuwaitLaosLatin AmericaLatviaLebanonLiberiaLithuaniaMalaysiaMexicoMicronesiaMiddle AfricaMoldovaMoroccoNepalNetherlandsNicaraguaNigeriaNorth AmericaNorth MacedoniaNorthern AfricaNorthern EuropeNorwayOceaniaPakistanPanamaPeruPhilippinesPolandPortugalRomaniaRussiaSaudi ArabiaScotlandSenegalSerbiaSierra LeoneSingaporeSomaliaSouth AfricaSouth AmericaSouth Central AsiaSouth Eastern AsiaSouthern EuropeSpainSri LankaSt. Vincent and the GrenadinesSudanSwedenSwitzerlandSyriaTaiwanThailandTrinidad and TobagoTurkeyUgandaUkraineUruguayUzbekistanVenezuelaVietnamWest IndiesWestern AfricaWestern AsiaWestern EuropeYemenZaireZimbabweAzores
Single Male Poverty
Income
Poverty
Unemployment
Labor Participation
Family Structure
Vehicle Availability
Education Level
Disability

Single Male Poverty Comparison

Shoshone

Immigrants from Latin America

Tragic
Tragic
16.7%
SINGLE MALE POVERTY
0.0/ 100
METRIC RATING
322nd/ 347
METRIC RANK
13.5%
SINGLE MALE POVERTY
1.3/ 100
METRIC RATING
245th/ 347
METRIC RANK

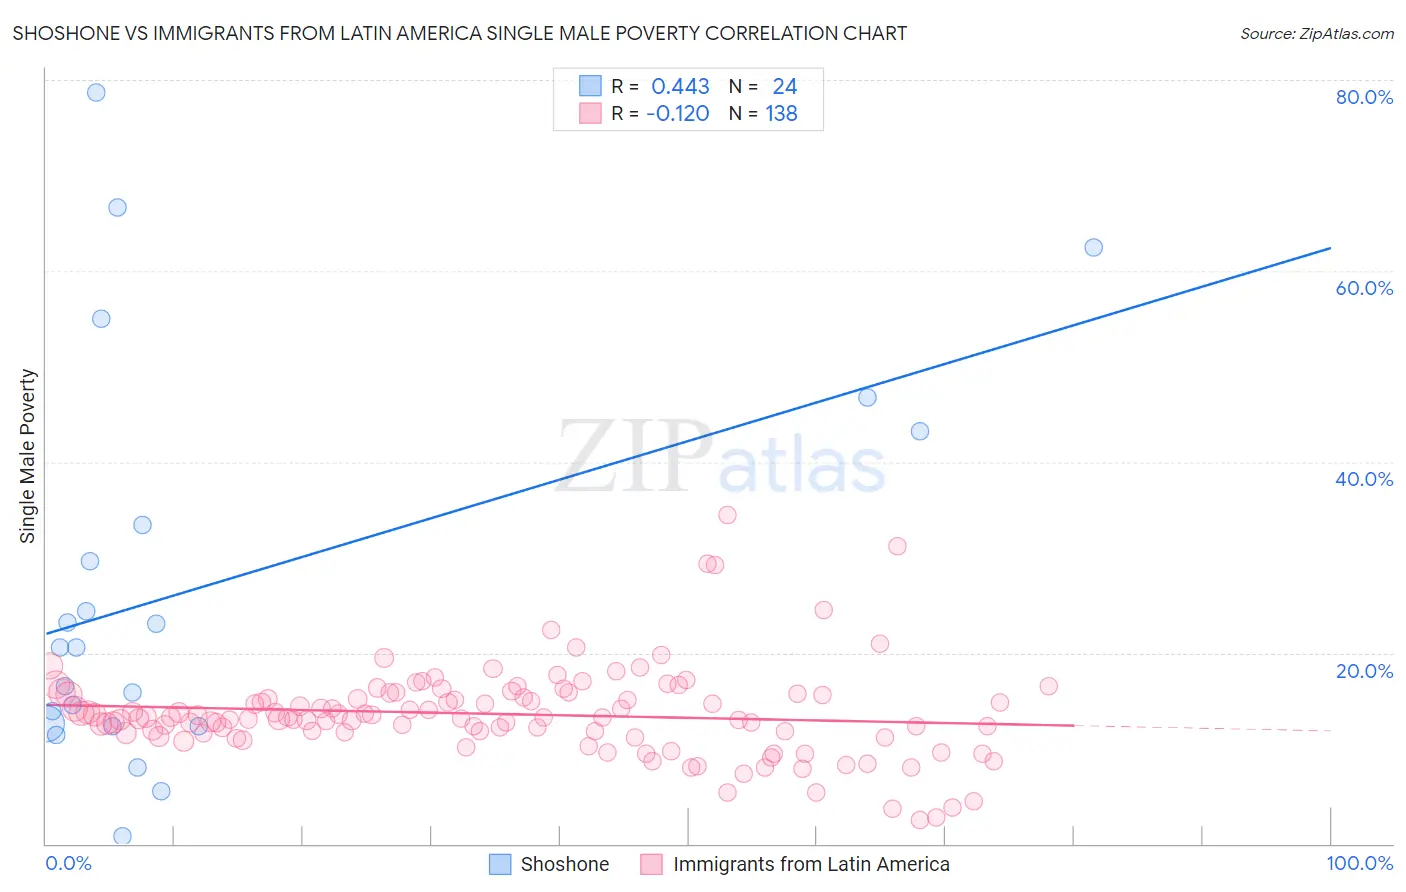
Shoshone vs Immigrants from Latin America Single Male Poverty Correlation Chart

The statistical analysis conducted on geographies consisting of 64,727,315 people shows a moderate positive correlation between the proportion of Shoshone and poverty level among single males in the United States with a correlation coefficient (R) of 0.443 and weighted average of 16.7%. Similarly, the statistical analysis conducted on geographies consisting of 467,663,456 people shows a poor negative correlation between the proportion of Immigrants from Latin America and poverty level among single males in the United States with a correlation coefficient (R) of -0.120 and weighted average of 13.5%, a difference of 23.3%.
Shoshone vs Immigrants from Latin America Single Male Poverty

Single Male Poverty Correlation Summary

MeasurementShoshoneImmigrants from Latin America
Minimum0.78%2.4%
Maximum78.7%34.5%
Range77.9%32.0%
Mean27.1%13.6%
Median20.6%13.2%
Interquartile 25% (IQ1)12.4%11.6%
Interquartile 75% (IQ3)38.3%15.6%
Interquartile Range (IQR)25.9%4.1%
Standard Deviation (Sample)20.9%4.8%
Standard Deviation (Population)20.5%4.8%

Similar Demographics by Single Male Poverty

Demographics Similar to Shoshone by Single Male Poverty

In terms of single male poverty, the demographic groups most similar to Shoshone are Creek (16.8%, a difference of 1.0%), Immigrants from Yemen (16.9%, a difference of 1.1%), Osage (16.5%, a difference of 1.3%), Marshallese (16.4%, a difference of 1.4%), and Chippewa (16.4%, a difference of 1.9%).
DemographicsRating | RankSingle Male Poverty
Cheyenne
0.0
/100
|
#315
Tragic
16.1%
Dutch West Indians
0.0
/100
|
#316
Tragic
16.1%
Blacks/African Americans
0.0
/100
|
#317
Tragic
16.2%
Chickasaw
0.0
/100
|
#318
Tragic
16.3%
Chippewa
0.0
/100
|
#319
Tragic
16.4%
Marshallese
0.0
/100
|
#320
Tragic
16.4%
Osage
0.0
/100
|
#321
Tragic
16.5%
Shoshone
0.0
/100
|
#322
Tragic
16.7%
Creek
0.0
/100
|
#323
Tragic
16.8%
Immigrants | Yemen
0.0
/100
|
#324
Tragic
16.9%
Choctaw
0.0
/100
|
#325
Tragic
17.0%
Central American Indians
0.0
/100
|
#326
Tragic
17.2%
Menominee
0.0
/100
|
#327
Tragic
17.7%
Kiowa
0.0
/100
|
#328
Tragic
18.3%
Colville
0.0
/100
|
#329
Tragic
18.4%

Demographics Similar to Immigrants from Latin America by Single Male Poverty

In terms of single male poverty, the demographic groups most similar to Immigrants from Latin America are Immigrants from Micronesia (13.5%, a difference of 0.10%), Belgian (13.5%, a difference of 0.12%), Czech (13.5%, a difference of 0.14%), Immigrants from Senegal (13.5%, a difference of 0.26%), and Spanish (13.6%, a difference of 0.38%).
DemographicsRating | RankSingle Male Poverty
Immigrants | Ghana
3.2
/100
|
#238
Tragic
13.4%
Czechoslovakians
3.0
/100
|
#239
Tragic
13.4%
Belizeans
2.3
/100
|
#240
Tragic
13.4%
Immigrants | Germany
2.1
/100
|
#241
Tragic
13.4%
Carpatho Rusyns
2.1
/100
|
#242
Tragic
13.4%
Barbadians
2.1
/100
|
#243
Tragic
13.4%
Immigrants | Senegal
1.7
/100
|
#244
Tragic
13.5%
Immigrants | Latin America
1.3
/100
|
#245
Tragic
13.5%
Immigrants | Micronesia
1.2
/100
|
#246
Tragic
13.5%
Belgians
1.2
/100
|
#247
Tragic
13.5%
Czechs
1.2
/100
|
#248
Tragic
13.5%
Spanish
1.0
/100
|
#249
Tragic
13.6%
Immigrants | Somalia
1.0
/100
|
#250
Tragic
13.6%
Immigrants | Zaire
0.9
/100
|
#251
Tragic
13.6%
Finns
0.9
/100
|
#252
Tragic
13.6%