Pakistani vs Immigrants from Eritrea Single Male Poverty
COMPARE
Pakistani
Immigrants from Eritrea
Single Male Poverty
Single Male Poverty Comparison
Pakistanis
Immigrants from Eritrea
12.4%
SINGLE MALE POVERTY
92.4/ 100
METRIC RATING
113th/ 347
METRIC RANK
12.1%
SINGLE MALE POVERTY
98.5/ 100
METRIC RATING
88th/ 347
METRIC RANK
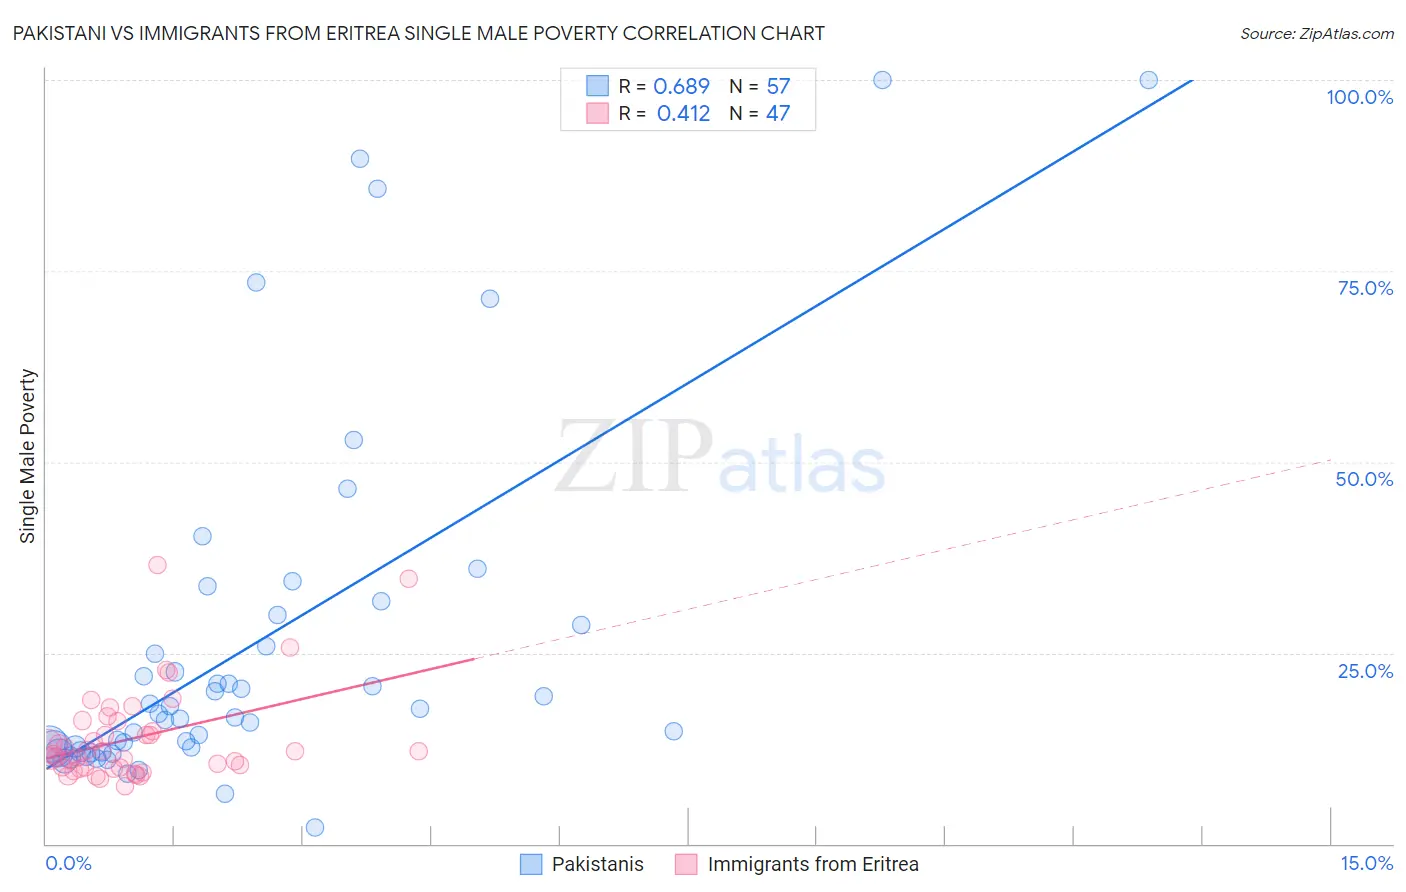
Pakistani vs Immigrants from Eritrea Single Male Poverty Correlation Chart
The statistical analysis conducted on geographies consisting of 304,084,454 people shows a significant positive correlation between the proportion of Pakistanis and poverty level among single males in the United States with a correlation coefficient (R) of 0.689 and weighted average of 12.4%. Similarly, the statistical analysis conducted on geographies consisting of 101,335,680 people shows a moderate positive correlation between the proportion of Immigrants from Eritrea and poverty level among single males in the United States with a correlation coefficient (R) of 0.412 and weighted average of 12.1%, a difference of 2.3%.
Single Male Poverty Correlation Summary
| Measurement | Pakistani | Immigrants from Eritrea |
| Minimum | 2.1% | 7.5% |
| Maximum | 100.0% | 36.5% |
| Range | 97.9% | 29.0% |
| Mean | 26.1% | 13.9% |
| Median | 17.0% | 12.1% |
| Interquartile 25% (IQ1) | 12.3% | 10.0% |
| Interquartile 75% (IQ3) | 29.3% | 16.0% |
| Interquartile Range (IQR) | 17.0% | 6.0% |
| Standard Deviation (Sample) | 23.4% | 6.1% |
| Standard Deviation (Population) | 23.2% | 6.1% |
Similar Demographics by Single Male Poverty
Demographics Similar to Pakistanis by Single Male Poverty
In terms of single male poverty, the demographic groups most similar to Pakistanis are Nicaraguan (12.4%, a difference of 0.050%), Immigrants from Southern Europe (12.4%, a difference of 0.15%), Kenyan (12.4%, a difference of 0.19%), Immigrants from Syria (12.4%, a difference of 0.21%), and Immigrants from Oceania (12.4%, a difference of 0.22%).
| Demographics | Rating | Rank | Single Male Poverty |
| Immigrants | Morocco | 95.6 /100 | #106 | Exceptional 12.3% |
| Iraqis | 95.1 /100 | #107 | Exceptional 12.3% |
| Immigrants | Eastern Africa | 95.0 /100 | #108 | Exceptional 12.3% |
| Ugandans | 94.5 /100 | #109 | Exceptional 12.3% |
| Immigrants | Portugal | 93.6 /100 | #110 | Exceptional 12.3% |
| Immigrants | North Macedonia | 93.6 /100 | #111 | Exceptional 12.3% |
| Kenyans | 93.3 /100 | #112 | Exceptional 12.4% |
| Pakistanis | 92.4 /100 | #113 | Exceptional 12.4% |
| Nicaraguans | 92.1 /100 | #114 | Exceptional 12.4% |
| Immigrants | Southern Europe | 91.5 /100 | #115 | Exceptional 12.4% |
| Immigrants | Syria | 91.2 /100 | #116 | Exceptional 12.4% |
| Immigrants | Oceania | 91.1 /100 | #117 | Exceptional 12.4% |
| Albanians | 90.6 /100 | #118 | Exceptional 12.4% |
| Immigrants | Albania | 90.3 /100 | #119 | Exceptional 12.4% |
| Venezuelans | 89.4 /100 | #120 | Excellent 12.4% |
Demographics Similar to Immigrants from Eritrea by Single Male Poverty
In terms of single male poverty, the demographic groups most similar to Immigrants from Eritrea are South American (12.1%, a difference of 0.0%), Immigrants from Israel (12.1%, a difference of 0.020%), Turkish (12.1%, a difference of 0.040%), Immigrants from Czechoslovakia (12.1%, a difference of 0.11%), and Immigrants from Colombia (12.1%, a difference of 0.14%).
| Demographics | Rating | Rank | Single Male Poverty |
| Immigrants | South America | 98.7 /100 | #81 | Exceptional 12.1% |
| Immigrants | Colombia | 98.6 /100 | #82 | Exceptional 12.1% |
| Immigrants | Chile | 98.6 /100 | #83 | Exceptional 12.1% |
| Immigrants | Czechoslovakia | 98.6 /100 | #84 | Exceptional 12.1% |
| Turks | 98.5 /100 | #85 | Exceptional 12.1% |
| Immigrants | Israel | 98.5 /100 | #86 | Exceptional 12.1% |
| South Americans | 98.5 /100 | #87 | Exceptional 12.1% |
| Immigrants | Eritrea | 98.5 /100 | #88 | Exceptional 12.1% |
| Immigrants | Ireland | 98.3 /100 | #89 | Exceptional 12.1% |
| South American Indians | 98.3 /100 | #90 | Exceptional 12.1% |
| Immigrants | Turkey | 98.2 /100 | #91 | Exceptional 12.1% |
| Spanish American Indians | 98.0 /100 | #92 | Exceptional 12.1% |
| Immigrants | Bosnia and Herzegovina | 97.9 /100 | #93 | Exceptional 12.1% |
| Colombians | 97.8 /100 | #94 | Exceptional 12.2% |
| Mongolians | 97.7 /100 | #95 | Exceptional 12.2% |