Shoshone vs Immigrants from Switzerland Single Male Poverty
COMPARE
Shoshone
Immigrants from Switzerland
Single Male Poverty
Single Male Poverty Comparison
Shoshone
Immigrants from Switzerland
16.7%
SINGLE MALE POVERTY
0.0/ 100
METRIC RATING
322nd/ 347
METRIC RANK
12.8%
SINGLE MALE POVERTY
43.1/ 100
METRIC RATING
178th/ 347
METRIC RANK
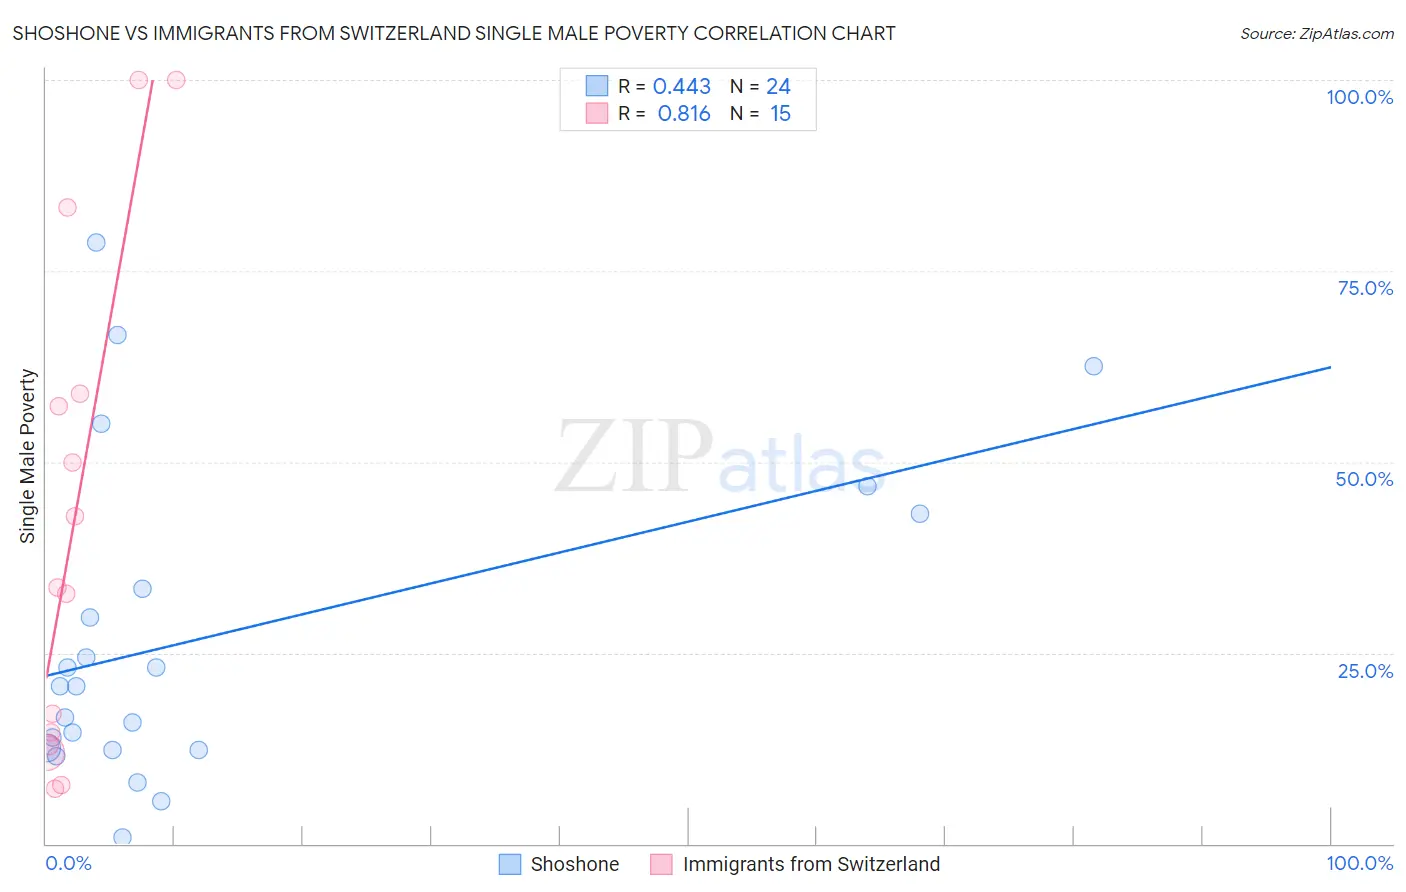
Shoshone vs Immigrants from Switzerland Single Male Poverty Correlation Chart
The statistical analysis conducted on geographies consisting of 64,727,315 people shows a moderate positive correlation between the proportion of Shoshone and poverty level among single males in the United States with a correlation coefficient (R) of 0.443 and weighted average of 16.7%. Similarly, the statistical analysis conducted on geographies consisting of 136,371,687 people shows a very strong positive correlation between the proportion of Immigrants from Switzerland and poverty level among single males in the United States with a correlation coefficient (R) of 0.816 and weighted average of 12.8%, a difference of 29.8%.
Single Male Poverty Correlation Summary
| Measurement | Shoshone | Immigrants from Switzerland |
| Minimum | 0.78% | 7.2% |
| Maximum | 78.7% | 100.0% |
| Range | 77.9% | 92.8% |
| Mean | 27.1% | 42.0% |
| Median | 20.6% | 33.6% |
| Interquartile 25% (IQ1) | 12.4% | 12.9% |
| Interquartile 75% (IQ3) | 38.3% | 58.9% |
| Interquartile Range (IQR) | 25.9% | 46.0% |
| Standard Deviation (Sample) | 20.9% | 32.4% |
| Standard Deviation (Population) | 20.5% | 31.3% |
Similar Demographics by Single Male Poverty
Demographics Similar to Shoshone by Single Male Poverty
In terms of single male poverty, the demographic groups most similar to Shoshone are Creek (16.8%, a difference of 1.0%), Immigrants from Yemen (16.9%, a difference of 1.1%), Osage (16.5%, a difference of 1.3%), Marshallese (16.4%, a difference of 1.4%), and Chippewa (16.4%, a difference of 1.9%).
| Demographics | Rating | Rank | Single Male Poverty |
| Cheyenne | 0.0 /100 | #315 | Tragic 16.1% |
| Dutch West Indians | 0.0 /100 | #316 | Tragic 16.1% |
| Blacks/African Americans | 0.0 /100 | #317 | Tragic 16.2% |
| Chickasaw | 0.0 /100 | #318 | Tragic 16.3% |
| Chippewa | 0.0 /100 | #319 | Tragic 16.4% |
| Marshallese | 0.0 /100 | #320 | Tragic 16.4% |
| Osage | 0.0 /100 | #321 | Tragic 16.5% |
| Shoshone | 0.0 /100 | #322 | Tragic 16.7% |
| Creek | 0.0 /100 | #323 | Tragic 16.8% |
| Immigrants | Yemen | 0.0 /100 | #324 | Tragic 16.9% |
| Choctaw | 0.0 /100 | #325 | Tragic 17.0% |
| Central American Indians | 0.0 /100 | #326 | Tragic 17.2% |
| Menominee | 0.0 /100 | #327 | Tragic 17.7% |
| Kiowa | 0.0 /100 | #328 | Tragic 18.3% |
| Colville | 0.0 /100 | #329 | Tragic 18.4% |
Demographics Similar to Immigrants from Switzerland by Single Male Poverty
In terms of single male poverty, the demographic groups most similar to Immigrants from Switzerland are Immigrants from Canada (12.8%, a difference of 0.090%), Israeli (12.9%, a difference of 0.11%), Syrian (12.8%, a difference of 0.28%), Immigrants from North America (12.9%, a difference of 0.29%), and Panamanian (12.9%, a difference of 0.30%).
| Demographics | Rating | Rank | Single Male Poverty |
| South Africans | 51.5 /100 | #171 | Average 12.8% |
| Danes | 51.4 /100 | #172 | Average 12.8% |
| Immigrants | St. Vincent and the Grenadines | 50.9 /100 | #173 | Average 12.8% |
| Costa Ricans | 50.0 /100 | #174 | Average 12.8% |
| Croatians | 48.9 /100 | #175 | Average 12.8% |
| Syrians | 48.4 /100 | #176 | Average 12.8% |
| Immigrants | Canada | 44.8 /100 | #177 | Average 12.8% |
| Immigrants | Switzerland | 43.1 /100 | #178 | Average 12.8% |
| Israelis | 41.0 /100 | #179 | Average 12.9% |
| Immigrants | North America | 37.7 /100 | #180 | Fair 12.9% |
| Panamanians | 37.6 /100 | #181 | Fair 12.9% |
| Moroccans | 36.8 /100 | #182 | Fair 12.9% |
| Immigrants | West Indies | 33.0 /100 | #183 | Fair 12.9% |
| Immigrants | Trinidad and Tobago | 32.5 /100 | #184 | Fair 12.9% |
| Norwegians | 32.0 /100 | #185 | Fair 12.9% |