Shoshone vs Alsatian Poverty
COMPARE
Shoshone
Alsatian
Poverty
Poverty Comparison
Shoshone
Alsatians
14.7%
POVERTY
0.0/ 100
METRIC RATING
271st/ 347
METRIC RANK
13.4%
POVERTY
2.6/ 100
METRIC RATING
221st/ 347
METRIC RANK
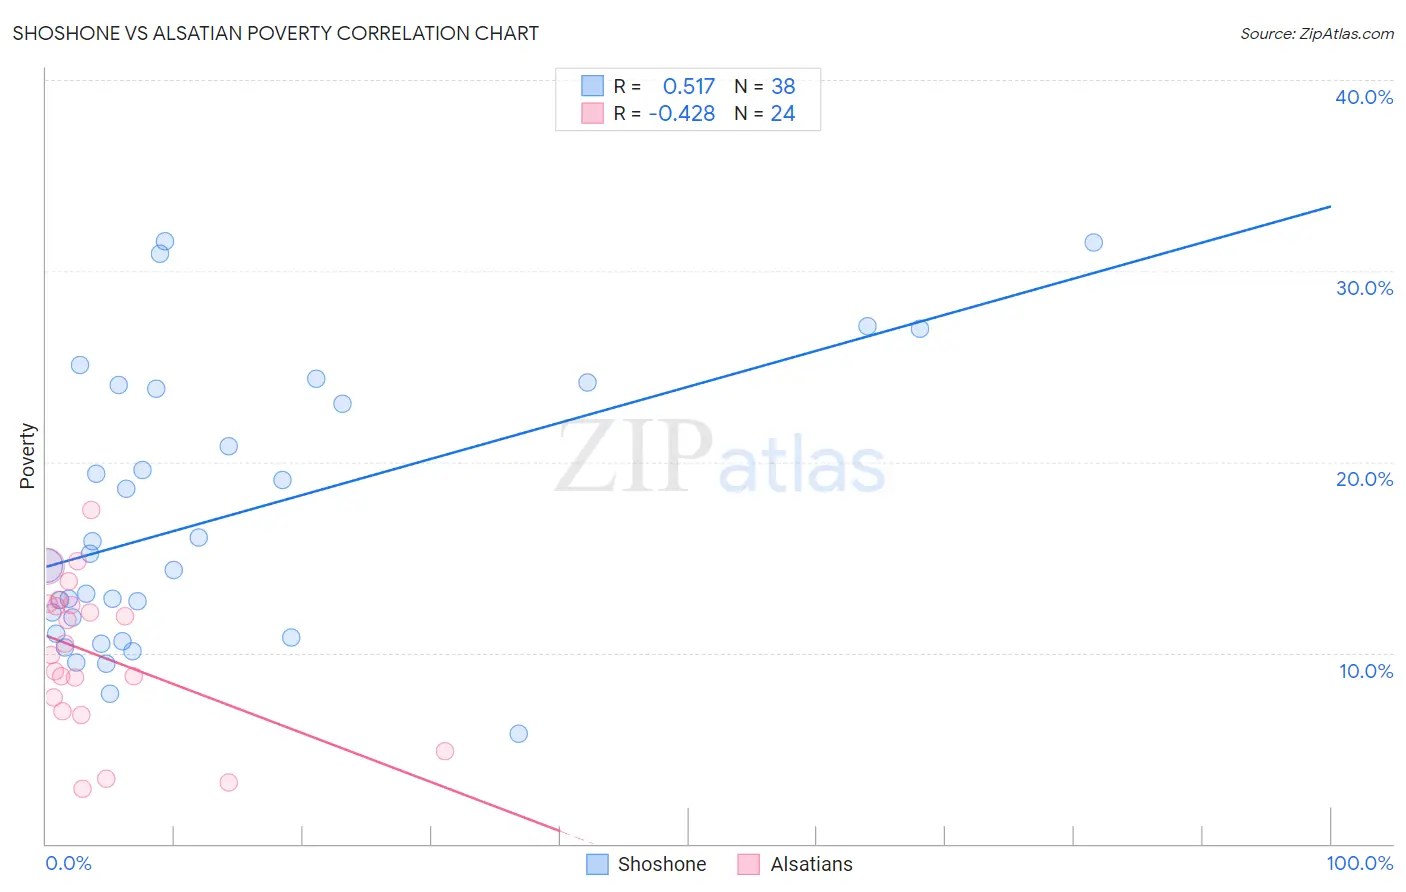
Shoshone vs Alsatian Poverty Correlation Chart
The statistical analysis conducted on geographies consisting of 66,616,342 people shows a substantial positive correlation between the proportion of Shoshone and poverty level in the United States with a correlation coefficient (R) of 0.517 and weighted average of 14.7%. Similarly, the statistical analysis conducted on geographies consisting of 82,679,902 people shows a moderate negative correlation between the proportion of Alsatians and poverty level in the United States with a correlation coefficient (R) of -0.428 and weighted average of 13.4%, a difference of 9.5%.
Poverty Correlation Summary
| Measurement | Shoshone | Alsatian |
| Minimum | 5.7% | 2.9% |
| Maximum | 31.5% | 17.5% |
| Range | 25.8% | 14.6% |
| Mean | 17.1% | 9.9% |
| Median | 14.9% | 10.2% |
| Interquartile 25% (IQ1) | 11.0% | 7.3% |
| Interquartile 75% (IQ3) | 23.8% | 12.5% |
| Interquartile Range (IQR) | 12.8% | 5.2% |
| Standard Deviation (Sample) | 7.1% | 3.9% |
| Standard Deviation (Population) | 7.0% | 3.8% |
Similar Demographics by Poverty
Demographics Similar to Shoshone by Poverty
In terms of poverty, the demographic groups most similar to Shoshone are Chickasaw (14.7%, a difference of 0.040%), Central American (14.6%, a difference of 0.58%), Spanish American (14.7%, a difference of 0.58%), Immigrants from Cuba (14.6%, a difference of 0.72%), and Subsaharan African (14.5%, a difference of 0.88%).
| Demographics | Rating | Rank | Poverty |
| Immigrants | Jamaica | 0.1 /100 | #264 | Tragic 14.4% |
| Immigrants | Guyana | 0.1 /100 | #265 | Tragic 14.5% |
| Guyanese | 0.1 /100 | #266 | Tragic 14.5% |
| Iroquois | 0.1 /100 | #267 | Tragic 14.5% |
| Sub-Saharan Africans | 0.1 /100 | #268 | Tragic 14.5% |
| Immigrants | Cuba | 0.1 /100 | #269 | Tragic 14.6% |
| Central Americans | 0.1 /100 | #270 | Tragic 14.6% |
| Shoshone | 0.0 /100 | #271 | Tragic 14.7% |
| Chickasaw | 0.0 /100 | #272 | Tragic 14.7% |
| Spanish Americans | 0.0 /100 | #273 | Tragic 14.7% |
| Barbadians | 0.0 /100 | #274 | Tragic 14.8% |
| Immigrants | West Indies | 0.0 /100 | #275 | Tragic 14.8% |
| Immigrants | Bahamas | 0.0 /100 | #276 | Tragic 14.8% |
| Bangladeshis | 0.0 /100 | #277 | Tragic 14.8% |
| Belizeans | 0.0 /100 | #278 | Tragic 14.8% |
Demographics Similar to Alsatians by Poverty
In terms of poverty, the demographic groups most similar to Alsatians are Immigrants from Micronesia (13.4%, a difference of 0.040%), Immigrants from Africa (13.4%, a difference of 0.080%), Immigrants from Eritrea (13.4%, a difference of 0.18%), American (13.4%, a difference of 0.20%), and Immigrants from Cambodia (13.4%, a difference of 0.29%).
| Demographics | Rating | Rank | Poverty |
| Bermudans | 3.7 /100 | #214 | Tragic 13.3% |
| Japanese | 3.3 /100 | #215 | Tragic 13.3% |
| Immigrants | Nonimmigrants | 3.3 /100 | #216 | Tragic 13.3% |
| Immigrants | Uzbekistan | 3.2 /100 | #217 | Tragic 13.3% |
| Immigrants | Thailand | 3.1 /100 | #218 | Tragic 13.3% |
| Immigrants | Cambodia | 3.0 /100 | #219 | Tragic 13.4% |
| Americans | 2.9 /100 | #220 | Tragic 13.4% |
| Alsatians | 2.6 /100 | #221 | Tragic 13.4% |
| Immigrants | Micronesia | 2.6 /100 | #222 | Tragic 13.4% |
| Immigrants | Africa | 2.5 /100 | #223 | Tragic 13.4% |
| Immigrants | Eritrea | 2.4 /100 | #224 | Tragic 13.4% |
| German Russians | 2.2 /100 | #225 | Tragic 13.4% |
| Marshallese | 2.2 /100 | #226 | Tragic 13.4% |
| Alaska Natives | 2.1 /100 | #227 | Tragic 13.5% |
| Immigrants | Nigeria | 1.7 /100 | #228 | Tragic 13.5% |