Shoshone vs U.S. Virgin Islander Poverty
COMPARE
Shoshone
U.S. Virgin Islander
Poverty
Poverty Comparison
Shoshone
U.S. Virgin Islanders
14.7%
POVERTY
0.0/ 100
METRIC RATING
271st/ 347
METRIC RANK
16.1%
POVERTY
0.0/ 100
METRIC RATING
317th/ 347
METRIC RANK
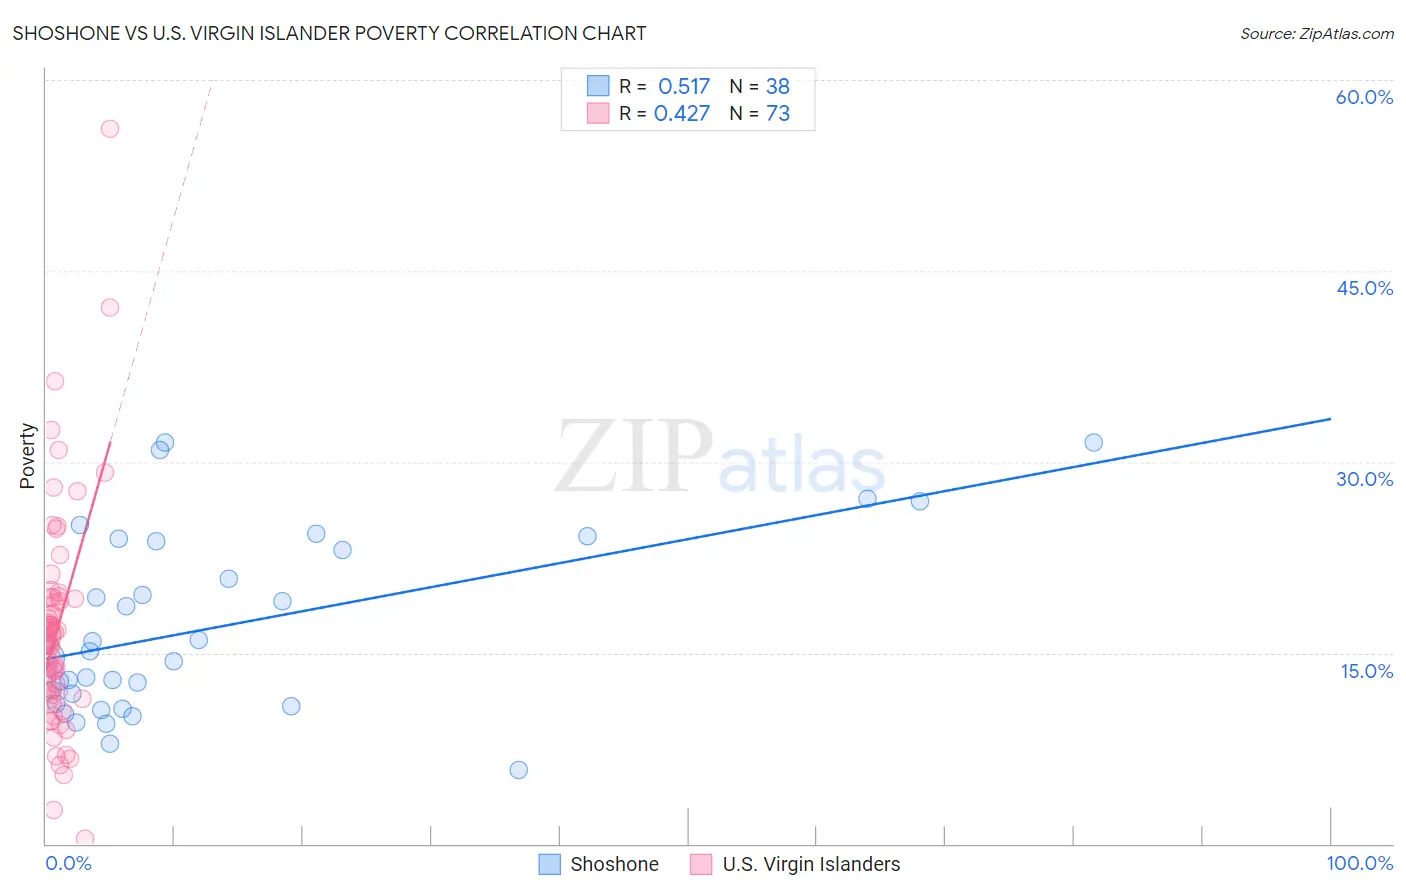
Shoshone vs U.S. Virgin Islander Poverty Correlation Chart
The statistical analysis conducted on geographies consisting of 66,616,342 people shows a substantial positive correlation between the proportion of Shoshone and poverty level in the United States with a correlation coefficient (R) of 0.517 and weighted average of 14.7%. Similarly, the statistical analysis conducted on geographies consisting of 87,513,467 people shows a moderate positive correlation between the proportion of U.S. Virgin Islanders and poverty level in the United States with a correlation coefficient (R) of 0.427 and weighted average of 16.1%, a difference of 9.5%.
Poverty Correlation Summary
| Measurement | Shoshone | U.S. Virgin Islander |
| Minimum | 5.7% | 0.43% |
| Maximum | 31.5% | 56.2% |
| Range | 25.8% | 55.8% |
| Mean | 17.1% | 16.8% |
| Median | 14.9% | 16.0% |
| Interquartile 25% (IQ1) | 11.0% | 11.8% |
| Interquartile 75% (IQ3) | 23.8% | 19.3% |
| Interquartile Range (IQR) | 12.8% | 7.5% |
| Standard Deviation (Sample) | 7.1% | 8.7% |
| Standard Deviation (Population) | 7.0% | 8.6% |
Similar Demographics by Poverty
Demographics Similar to Shoshone by Poverty
In terms of poverty, the demographic groups most similar to Shoshone are Chickasaw (14.7%, a difference of 0.040%), Central American (14.6%, a difference of 0.58%), Spanish American (14.7%, a difference of 0.58%), Immigrants from Cuba (14.6%, a difference of 0.72%), and Subsaharan African (14.5%, a difference of 0.88%).
| Demographics | Rating | Rank | Poverty |
| Immigrants | Jamaica | 0.1 /100 | #264 | Tragic 14.4% |
| Immigrants | Guyana | 0.1 /100 | #265 | Tragic 14.5% |
| Guyanese | 0.1 /100 | #266 | Tragic 14.5% |
| Iroquois | 0.1 /100 | #267 | Tragic 14.5% |
| Sub-Saharan Africans | 0.1 /100 | #268 | Tragic 14.5% |
| Immigrants | Cuba | 0.1 /100 | #269 | Tragic 14.6% |
| Central Americans | 0.1 /100 | #270 | Tragic 14.6% |
| Shoshone | 0.0 /100 | #271 | Tragic 14.7% |
| Chickasaw | 0.0 /100 | #272 | Tragic 14.7% |
| Spanish Americans | 0.0 /100 | #273 | Tragic 14.7% |
| Barbadians | 0.0 /100 | #274 | Tragic 14.8% |
| Immigrants | West Indies | 0.0 /100 | #275 | Tragic 14.8% |
| Immigrants | Bahamas | 0.0 /100 | #276 | Tragic 14.8% |
| Bangladeshis | 0.0 /100 | #277 | Tragic 14.8% |
| Belizeans | 0.0 /100 | #278 | Tragic 14.8% |
Demographics Similar to U.S. Virgin Islanders by Poverty
In terms of poverty, the demographic groups most similar to U.S. Virgin Islanders are Immigrants from Dominica (16.1%, a difference of 0.29%), Immigrants from Congo (16.1%, a difference of 0.49%), Immigrants from Honduras (16.2%, a difference of 0.72%), British West Indian (15.9%, a difference of 1.3%), and Honduran (15.9%, a difference of 1.3%).
| Demographics | Rating | Rank | Poverty |
| Dutch West Indians | 0.0 /100 | #310 | Tragic 15.6% |
| Chippewa | 0.0 /100 | #311 | Tragic 15.7% |
| Cajuns | 0.0 /100 | #312 | Tragic 15.7% |
| Immigrants | Grenada | 0.0 /100 | #313 | Tragic 15.8% |
| Immigrants | Somalia | 0.0 /100 | #314 | Tragic 15.8% |
| British West Indians | 0.0 /100 | #315 | Tragic 15.9% |
| Hondurans | 0.0 /100 | #316 | Tragic 15.9% |
| U.S. Virgin Islanders | 0.0 /100 | #317 | Tragic 16.1% |
| Immigrants | Dominica | 0.0 /100 | #318 | Tragic 16.1% |
| Immigrants | Congo | 0.0 /100 | #319 | Tragic 16.1% |
| Immigrants | Honduras | 0.0 /100 | #320 | Tragic 16.2% |
| Arapaho | 0.0 /100 | #321 | Tragic 16.3% |
| Menominee | 0.0 /100 | #322 | Tragic 16.4% |
| Colville | 0.0 /100 | #323 | Tragic 16.6% |
| Yakama | 0.0 /100 | #324 | Tragic 16.7% |