Shoshone vs Aleut Poverty
COMPARE
Shoshone
Aleut
Poverty
Poverty Comparison
Shoshone
Aleuts
14.7%
POVERTY
0.0/ 100
METRIC RATING
271st/ 347
METRIC RANK
12.5%
POVERTY
33.2/ 100
METRIC RATING
189th/ 347
METRIC RANK
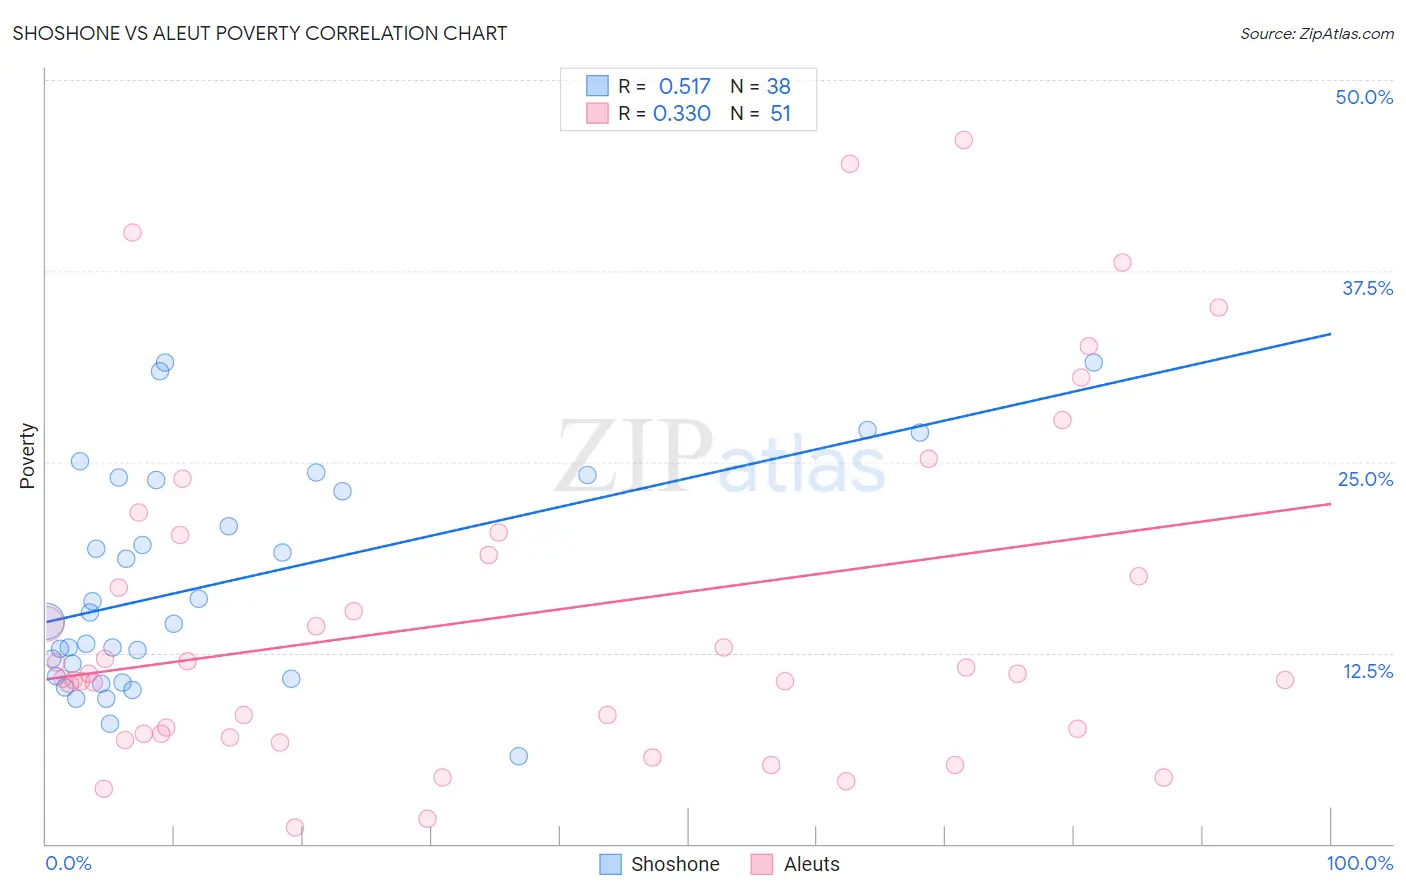
Shoshone vs Aleut Poverty Correlation Chart
The statistical analysis conducted on geographies consisting of 66,616,342 people shows a substantial positive correlation between the proportion of Shoshone and poverty level in the United States with a correlation coefficient (R) of 0.517 and weighted average of 14.7%. Similarly, the statistical analysis conducted on geographies consisting of 61,776,173 people shows a mild positive correlation between the proportion of Aleuts and poverty level in the United States with a correlation coefficient (R) of 0.330 and weighted average of 12.5%, a difference of 17.1%.
Poverty Correlation Summary
| Measurement | Shoshone | Aleut |
| Minimum | 5.7% | 1.1% |
| Maximum | 31.5% | 46.0% |
| Range | 25.8% | 44.9% |
| Mean | 17.1% | 14.9% |
| Median | 14.9% | 11.1% |
| Interquartile 25% (IQ1) | 11.0% | 7.2% |
| Interquartile 75% (IQ3) | 23.8% | 20.2% |
| Interquartile Range (IQR) | 12.8% | 13.0% |
| Standard Deviation (Sample) | 7.1% | 11.2% |
| Standard Deviation (Population) | 7.0% | 11.1% |
Similar Demographics by Poverty
Demographics Similar to Shoshone by Poverty
In terms of poverty, the demographic groups most similar to Shoshone are Chickasaw (14.7%, a difference of 0.040%), Central American (14.6%, a difference of 0.58%), Spanish American (14.7%, a difference of 0.58%), Immigrants from Cuba (14.6%, a difference of 0.72%), and Subsaharan African (14.5%, a difference of 0.88%).
| Demographics | Rating | Rank | Poverty |
| Immigrants | Jamaica | 0.1 /100 | #264 | Tragic 14.4% |
| Immigrants | Guyana | 0.1 /100 | #265 | Tragic 14.5% |
| Guyanese | 0.1 /100 | #266 | Tragic 14.5% |
| Iroquois | 0.1 /100 | #267 | Tragic 14.5% |
| Sub-Saharan Africans | 0.1 /100 | #268 | Tragic 14.5% |
| Immigrants | Cuba | 0.1 /100 | #269 | Tragic 14.6% |
| Central Americans | 0.1 /100 | #270 | Tragic 14.6% |
| Shoshone | 0.0 /100 | #271 | Tragic 14.7% |
| Chickasaw | 0.0 /100 | #272 | Tragic 14.7% |
| Spanish Americans | 0.0 /100 | #273 | Tragic 14.7% |
| Barbadians | 0.0 /100 | #274 | Tragic 14.8% |
| Immigrants | West Indies | 0.0 /100 | #275 | Tragic 14.8% |
| Immigrants | Bahamas | 0.0 /100 | #276 | Tragic 14.8% |
| Bangladeshis | 0.0 /100 | #277 | Tragic 14.8% |
| Belizeans | 0.0 /100 | #278 | Tragic 14.8% |
Demographics Similar to Aleuts by Poverty
In terms of poverty, the demographic groups most similar to Aleuts are Immigrants from Costa Rica (12.5%, a difference of 0.010%), Hawaiian (12.5%, a difference of 0.090%), Immigrants from South America (12.5%, a difference of 0.090%), Sierra Leonean (12.6%, a difference of 0.19%), and Immigrants from Sierra Leone (12.5%, a difference of 0.32%).
| Demographics | Rating | Rank | Poverty |
| Immigrants | Cameroon | 41.7 /100 | #182 | Average 12.4% |
| Immigrants | Iraq | 40.2 /100 | #183 | Average 12.4% |
| Kenyans | 38.8 /100 | #184 | Fair 12.5% |
| Israelis | 36.4 /100 | #185 | Fair 12.5% |
| Immigrants | Sierra Leone | 36.3 /100 | #186 | Fair 12.5% |
| Hawaiians | 34.1 /100 | #187 | Fair 12.5% |
| Immigrants | Costa Rica | 33.3 /100 | #188 | Fair 12.5% |
| Aleuts | 33.2 /100 | #189 | Fair 12.5% |
| Immigrants | South America | 32.3 /100 | #190 | Fair 12.5% |
| Sierra Leoneans | 31.5 /100 | #191 | Fair 12.6% |
| South American Indians | 23.3 /100 | #192 | Fair 12.7% |
| Delaware | 21.4 /100 | #193 | Fair 12.7% |
| Arabs | 21.1 /100 | #194 | Fair 12.7% |
| Immigrants | Kuwait | 20.9 /100 | #195 | Fair 12.7% |
| Iraqis | 20.8 /100 | #196 | Fair 12.7% |