Immigrants from Senegal vs Alsatian Poverty
COMPARE
Immigrants from Senegal
Alsatian
Poverty
Poverty Comparison
Immigrants from Senegal
Alsatians
15.3%
POVERTY
0.0/ 100
METRIC RATING
298th/ 347
METRIC RANK
13.4%
POVERTY
2.6/ 100
METRIC RATING
221st/ 347
METRIC RANK
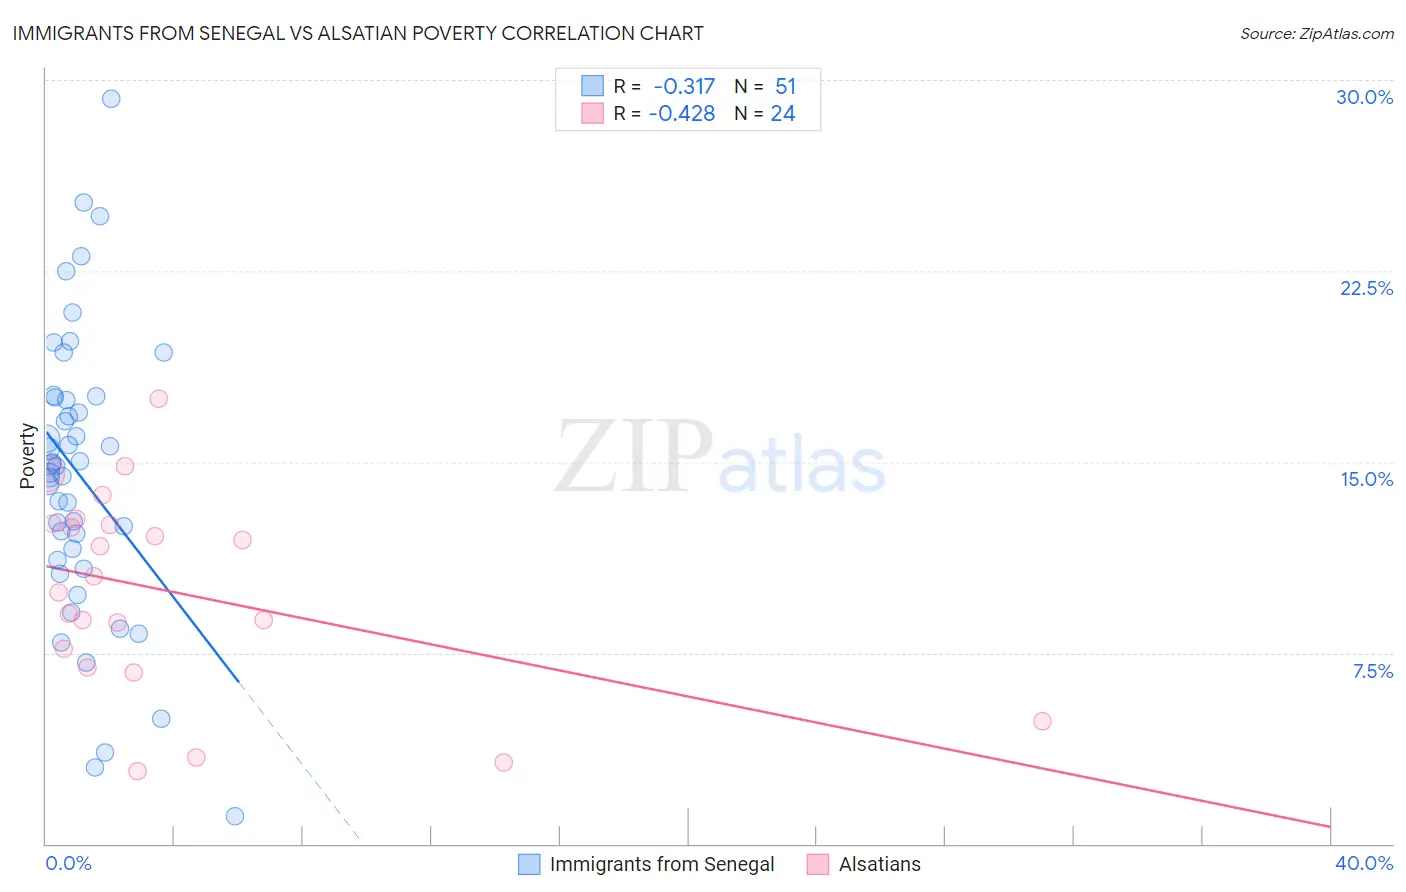
Immigrants from Senegal vs Alsatian Poverty Correlation Chart
The statistical analysis conducted on geographies consisting of 90,124,695 people shows a mild negative correlation between the proportion of Immigrants from Senegal and poverty level in the United States with a correlation coefficient (R) of -0.317 and weighted average of 15.3%. Similarly, the statistical analysis conducted on geographies consisting of 82,679,902 people shows a moderate negative correlation between the proportion of Alsatians and poverty level in the United States with a correlation coefficient (R) of -0.428 and weighted average of 13.4%, a difference of 14.1%.
Poverty Correlation Summary
| Measurement | Immigrants from Senegal | Alsatian |
| Minimum | 1.1% | 2.9% |
| Maximum | 29.3% | 17.5% |
| Range | 28.2% | 14.6% |
| Mean | 14.4% | 9.9% |
| Median | 14.8% | 10.2% |
| Interquartile 25% (IQ1) | 11.1% | 7.3% |
| Interquartile 75% (IQ3) | 17.5% | 12.5% |
| Interquartile Range (IQR) | 6.4% | 5.2% |
| Standard Deviation (Sample) | 5.6% | 3.9% |
| Standard Deviation (Population) | 5.6% | 3.8% |
Similar Demographics by Poverty
Demographics Similar to Immigrants from Senegal by Poverty
In terms of poverty, the demographic groups most similar to Immigrants from Senegal are Senegalese (15.3%, a difference of 0.090%), Immigrants from Bangladesh (15.3%, a difference of 0.15%), Hispanic or Latino (15.3%, a difference of 0.19%), Guatemalan (15.3%, a difference of 0.20%), and Immigrants from Central America (15.4%, a difference of 0.47%).
| Demographics | Rating | Rank | Poverty |
| Immigrants | Cabo Verde | 0.0 /100 | #291 | Tragic 15.1% |
| Indonesians | 0.0 /100 | #292 | Tragic 15.1% |
| Immigrants | Zaire | 0.0 /100 | #293 | Tragic 15.1% |
| Blackfeet | 0.0 /100 | #294 | Tragic 15.2% |
| Guatemalans | 0.0 /100 | #295 | Tragic 15.3% |
| Hispanics or Latinos | 0.0 /100 | #296 | Tragic 15.3% |
| Immigrants | Bangladesh | 0.0 /100 | #297 | Tragic 15.3% |
| Immigrants | Senegal | 0.0 /100 | #298 | Tragic 15.3% |
| Senegalese | 0.0 /100 | #299 | Tragic 15.3% |
| Immigrants | Central America | 0.0 /100 | #300 | Tragic 15.4% |
| Bahamians | 0.0 /100 | #301 | Tragic 15.4% |
| Somalis | 0.0 /100 | #302 | Tragic 15.4% |
| Immigrants | Caribbean | 0.0 /100 | #303 | Tragic 15.5% |
| Immigrants | Mexico | 0.0 /100 | #304 | Tragic 15.5% |
| Immigrants | Guatemala | 0.0 /100 | #305 | Tragic 15.5% |
Demographics Similar to Alsatians by Poverty
In terms of poverty, the demographic groups most similar to Alsatians are Immigrants from Micronesia (13.4%, a difference of 0.040%), Immigrants from Africa (13.4%, a difference of 0.080%), Immigrants from Eritrea (13.4%, a difference of 0.18%), American (13.4%, a difference of 0.20%), and Immigrants from Cambodia (13.4%, a difference of 0.29%).
| Demographics | Rating | Rank | Poverty |
| Bermudans | 3.7 /100 | #214 | Tragic 13.3% |
| Japanese | 3.3 /100 | #215 | Tragic 13.3% |
| Immigrants | Nonimmigrants | 3.3 /100 | #216 | Tragic 13.3% |
| Immigrants | Uzbekistan | 3.2 /100 | #217 | Tragic 13.3% |
| Immigrants | Thailand | 3.1 /100 | #218 | Tragic 13.3% |
| Immigrants | Cambodia | 3.0 /100 | #219 | Tragic 13.4% |
| Americans | 2.9 /100 | #220 | Tragic 13.4% |
| Alsatians | 2.6 /100 | #221 | Tragic 13.4% |
| Immigrants | Micronesia | 2.6 /100 | #222 | Tragic 13.4% |
| Immigrants | Africa | 2.5 /100 | #223 | Tragic 13.4% |
| Immigrants | Eritrea | 2.4 /100 | #224 | Tragic 13.4% |
| German Russians | 2.2 /100 | #225 | Tragic 13.4% |
| Marshallese | 2.2 /100 | #226 | Tragic 13.4% |
| Alaska Natives | 2.1 /100 | #227 | Tragic 13.5% |
| Immigrants | Nigeria | 1.7 /100 | #228 | Tragic 13.5% |