Shoshone vs Immigrants from Oceania Poverty
COMPARE
Shoshone
Immigrants from Oceania
Poverty
Poverty Comparison
Shoshone
Immigrants from Oceania
14.7%
POVERTY
0.0/ 100
METRIC RATING
271st/ 347
METRIC RANK
12.3%
POVERTY
54.6/ 100
METRIC RATING
170th/ 347
METRIC RANK
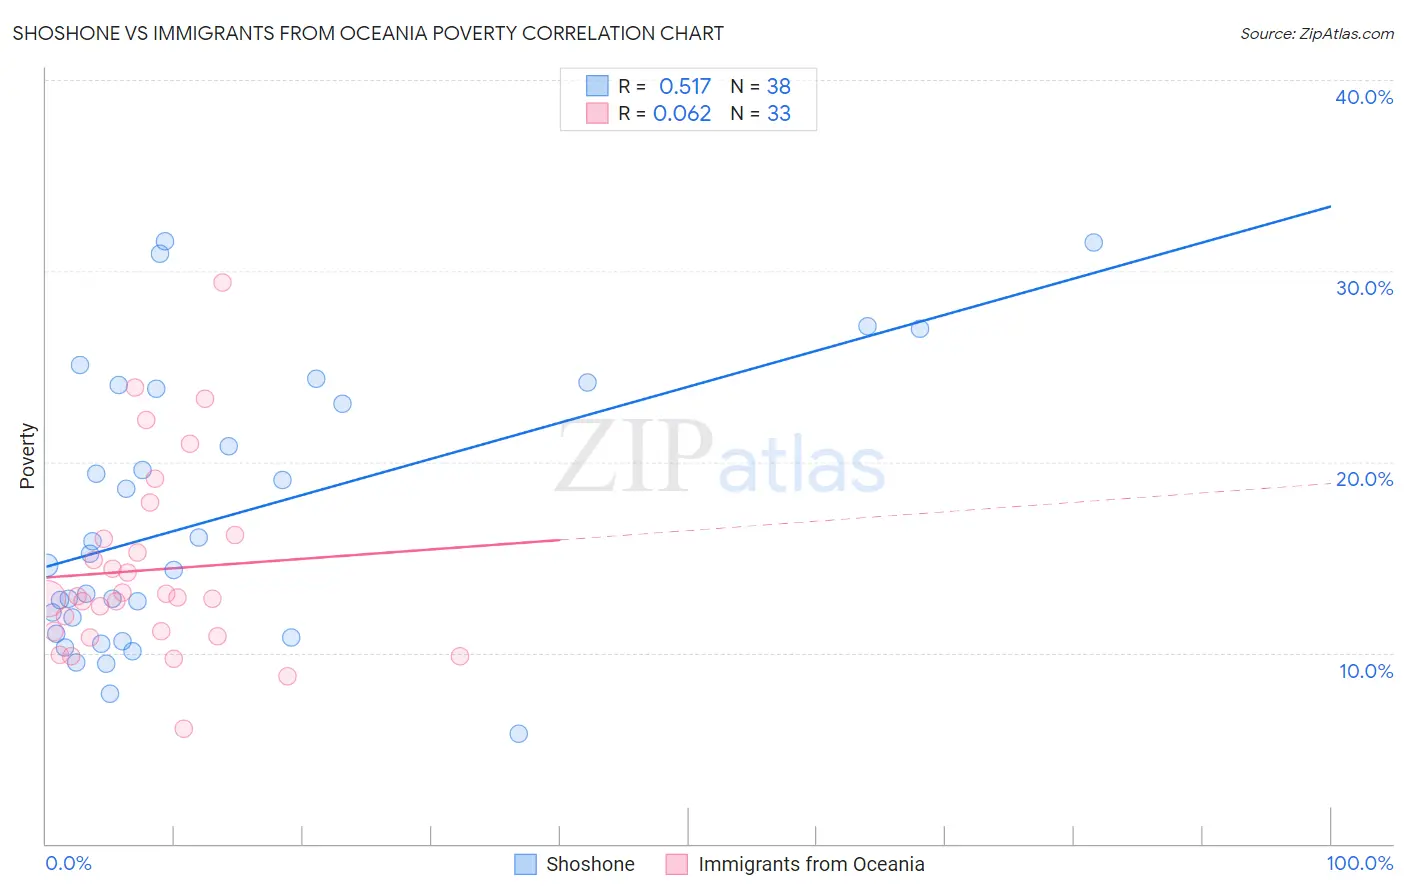
Shoshone vs Immigrants from Oceania Poverty Correlation Chart
The statistical analysis conducted on geographies consisting of 66,616,342 people shows a substantial positive correlation between the proportion of Shoshone and poverty level in the United States with a correlation coefficient (R) of 0.517 and weighted average of 14.7%. Similarly, the statistical analysis conducted on geographies consisting of 305,386,119 people shows a slight positive correlation between the proportion of Immigrants from Oceania and poverty level in the United States with a correlation coefficient (R) of 0.062 and weighted average of 12.3%, a difference of 19.6%.
Poverty Correlation Summary
| Measurement | Shoshone | Immigrants from Oceania |
| Minimum | 5.7% | 6.0% |
| Maximum | 31.5% | 29.4% |
| Range | 25.8% | 23.4% |
| Mean | 17.1% | 14.3% |
| Median | 14.9% | 12.9% |
| Interquartile 25% (IQ1) | 11.0% | 11.0% |
| Interquartile 75% (IQ3) | 23.8% | 16.1% |
| Interquartile Range (IQR) | 12.8% | 5.1% |
| Standard Deviation (Sample) | 7.1% | 5.0% |
| Standard Deviation (Population) | 7.0% | 4.9% |
Similar Demographics by Poverty
Demographics Similar to Shoshone by Poverty
In terms of poverty, the demographic groups most similar to Shoshone are Chickasaw (14.7%, a difference of 0.040%), Central American (14.6%, a difference of 0.58%), Spanish American (14.7%, a difference of 0.58%), Immigrants from Cuba (14.6%, a difference of 0.72%), and Subsaharan African (14.5%, a difference of 0.88%).
| Demographics | Rating | Rank | Poverty |
| Immigrants | Jamaica | 0.1 /100 | #264 | Tragic 14.4% |
| Immigrants | Guyana | 0.1 /100 | #265 | Tragic 14.5% |
| Guyanese | 0.1 /100 | #266 | Tragic 14.5% |
| Iroquois | 0.1 /100 | #267 | Tragic 14.5% |
| Sub-Saharan Africans | 0.1 /100 | #268 | Tragic 14.5% |
| Immigrants | Cuba | 0.1 /100 | #269 | Tragic 14.6% |
| Central Americans | 0.1 /100 | #270 | Tragic 14.6% |
| Shoshone | 0.0 /100 | #271 | Tragic 14.7% |
| Chickasaw | 0.0 /100 | #272 | Tragic 14.7% |
| Spanish Americans | 0.0 /100 | #273 | Tragic 14.7% |
| Barbadians | 0.0 /100 | #274 | Tragic 14.8% |
| Immigrants | West Indies | 0.0 /100 | #275 | Tragic 14.8% |
| Immigrants | Bahamas | 0.0 /100 | #276 | Tragic 14.8% |
| Bangladeshis | 0.0 /100 | #277 | Tragic 14.8% |
| Belizeans | 0.0 /100 | #278 | Tragic 14.8% |
Demographics Similar to Immigrants from Oceania by Poverty
In terms of poverty, the demographic groups most similar to Immigrants from Oceania are White/Caucasian (12.3%, a difference of 0.080%), Immigrants from Venezuela (12.2%, a difference of 0.19%), Immigrants from Chile (12.2%, a difference of 0.21%), Venezuelan (12.2%, a difference of 0.23%), and Immigrants from Albania (12.2%, a difference of 0.31%).
| Demographics | Rating | Rank | Poverty |
| Immigrants | Ethiopia | 58.6 /100 | #163 | Average 12.2% |
| Colombians | 57.8 /100 | #164 | Average 12.2% |
| Immigrants | Albania | 57.7 /100 | #165 | Average 12.2% |
| Venezuelans | 56.9 /100 | #166 | Average 12.2% |
| Immigrants | Chile | 56.7 /100 | #167 | Average 12.2% |
| Immigrants | Venezuela | 56.5 /100 | #168 | Average 12.2% |
| Whites/Caucasians | 55.4 /100 | #169 | Average 12.3% |
| Immigrants | Oceania | 54.6 /100 | #170 | Average 12.3% |
| Immigrants | Spain | 51.3 /100 | #171 | Average 12.3% |
| Immigrants | Portugal | 50.5 /100 | #172 | Average 12.3% |
| Celtics | 50.1 /100 | #173 | Average 12.3% |
| Lebanese | 50.0 /100 | #174 | Average 12.3% |
| South Americans | 48.7 /100 | #175 | Average 12.3% |
| Immigrants | Colombia | 47.7 /100 | #176 | Average 12.3% |
| Immigrants | Syria | 47.5 /100 | #177 | Average 12.3% |