Osage vs Alsatian Poverty
COMPARE
Osage
Alsatian
Poverty
Poverty Comparison
Osage
Alsatians
13.6%
POVERTY
1.5/ 100
METRIC RATING
229th/ 347
METRIC RANK
13.4%
POVERTY
2.6/ 100
METRIC RATING
221st/ 347
METRIC RANK
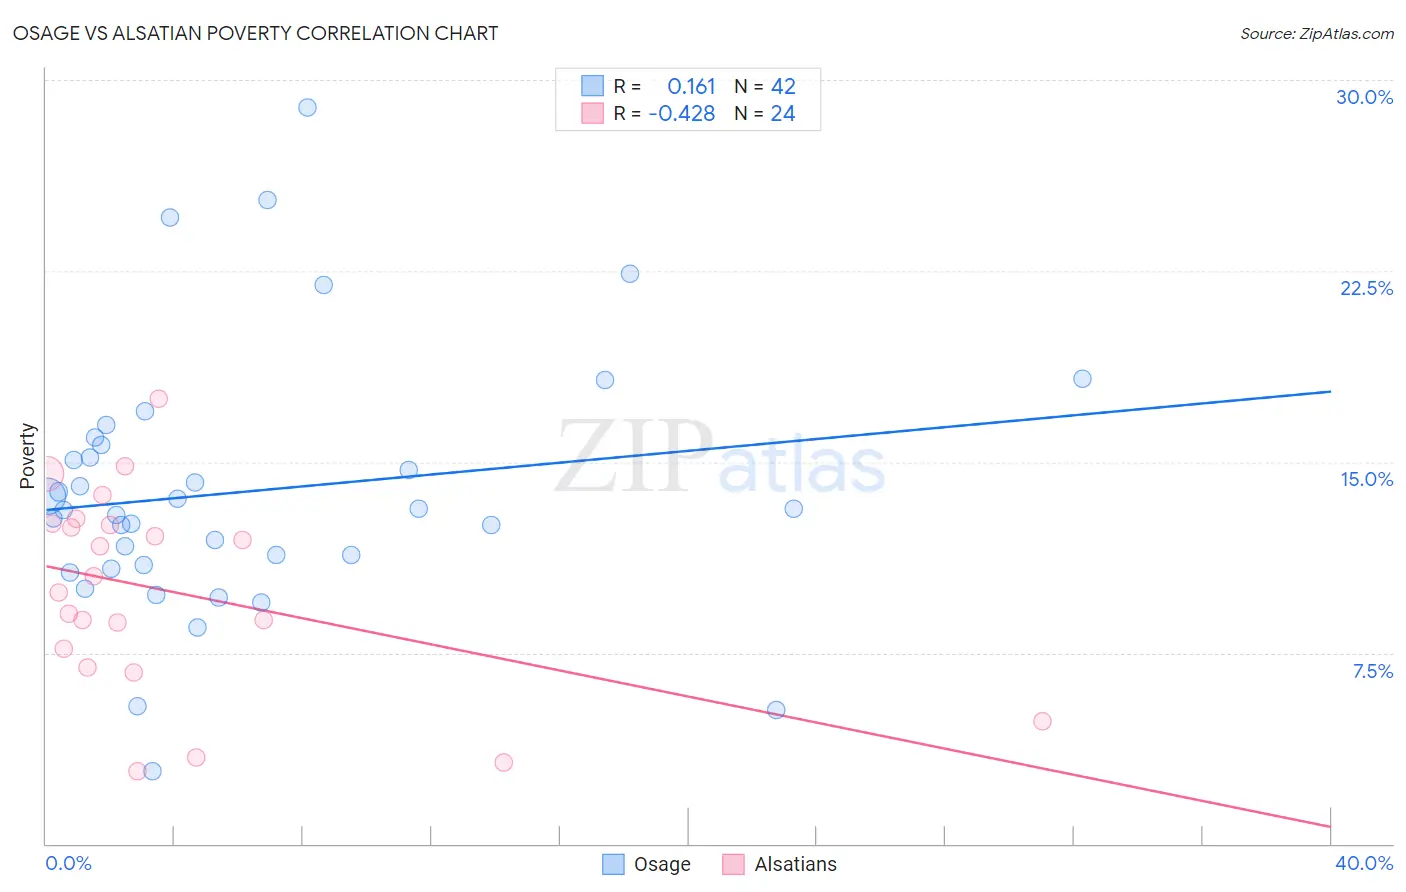
Osage vs Alsatian Poverty Correlation Chart
The statistical analysis conducted on geographies consisting of 91,797,306 people shows a poor positive correlation between the proportion of Osage and poverty level in the United States with a correlation coefficient (R) of 0.161 and weighted average of 13.6%. Similarly, the statistical analysis conducted on geographies consisting of 82,679,902 people shows a moderate negative correlation between the proportion of Alsatians and poverty level in the United States with a correlation coefficient (R) of -0.428 and weighted average of 13.4%, a difference of 1.3%.
Poverty Correlation Summary
| Measurement | Osage | Alsatian |
| Minimum | 2.8% | 2.9% |
| Maximum | 28.9% | 17.5% |
| Range | 26.1% | 14.6% |
| Mean | 13.8% | 9.9% |
| Median | 13.1% | 10.2% |
| Interquartile 25% (IQ1) | 10.9% | 7.3% |
| Interquartile 75% (IQ3) | 15.7% | 12.5% |
| Interquartile Range (IQR) | 4.7% | 5.2% |
| Standard Deviation (Sample) | 5.2% | 3.9% |
| Standard Deviation (Population) | 5.1% | 3.8% |
Demographics Similar to Osage and Alsatians by Poverty
In terms of poverty, the demographic groups most similar to Osage are Alaskan Athabascan (13.6%, a difference of 0.060%), Nigerian (13.6%, a difference of 0.22%), Immigrants from Nigeria (13.5%, a difference of 0.24%), Alaska Native (13.5%, a difference of 0.69%), and Marshallese (13.4%, a difference of 0.85%). Similarly, the demographic groups most similar to Alsatians are Immigrants from Micronesia (13.4%, a difference of 0.040%), Immigrants from Africa (13.4%, a difference of 0.080%), Immigrants from Eritrea (13.4%, a difference of 0.18%), American (13.4%, a difference of 0.20%), and Immigrants from Cambodia (13.4%, a difference of 0.29%).
| Demographics | Rating | Rank | Poverty |
| Japanese | 3.3 /100 | #215 | Tragic 13.3% |
| Immigrants | Nonimmigrants | 3.3 /100 | #216 | Tragic 13.3% |
| Immigrants | Uzbekistan | 3.2 /100 | #217 | Tragic 13.3% |
| Immigrants | Thailand | 3.1 /100 | #218 | Tragic 13.3% |
| Immigrants | Cambodia | 3.0 /100 | #219 | Tragic 13.4% |
| Americans | 2.9 /100 | #220 | Tragic 13.4% |
| Alsatians | 2.6 /100 | #221 | Tragic 13.4% |
| Immigrants | Micronesia | 2.6 /100 | #222 | Tragic 13.4% |
| Immigrants | Africa | 2.5 /100 | #223 | Tragic 13.4% |
| Immigrants | Eritrea | 2.4 /100 | #224 | Tragic 13.4% |
| German Russians | 2.2 /100 | #225 | Tragic 13.4% |
| Marshallese | 2.2 /100 | #226 | Tragic 13.4% |
| Alaska Natives | 2.1 /100 | #227 | Tragic 13.5% |
| Immigrants | Nigeria | 1.7 /100 | #228 | Tragic 13.5% |
| Osage | 1.5 /100 | #229 | Tragic 13.6% |
| Alaskan Athabascans | 1.5 /100 | #230 | Tragic 13.6% |
| Nigerians | 1.4 /100 | #231 | Tragic 13.6% |
| Fijians | 0.8 /100 | #232 | Tragic 13.7% |
| Immigrants | Saudi Arabia | 0.8 /100 | #233 | Tragic 13.8% |
| Immigrants | Laos | 0.7 /100 | #234 | Tragic 13.8% |
| Cubans | 0.6 /100 | #235 | Tragic 13.9% |