Shoshone vs Senegalese Poverty
COMPARE
Shoshone
Senegalese
Poverty
Poverty Comparison
Shoshone
Senegalese
14.7%
POVERTY
0.0/ 100
METRIC RATING
271st/ 347
METRIC RANK
15.3%
POVERTY
0.0/ 100
METRIC RATING
299th/ 347
METRIC RANK
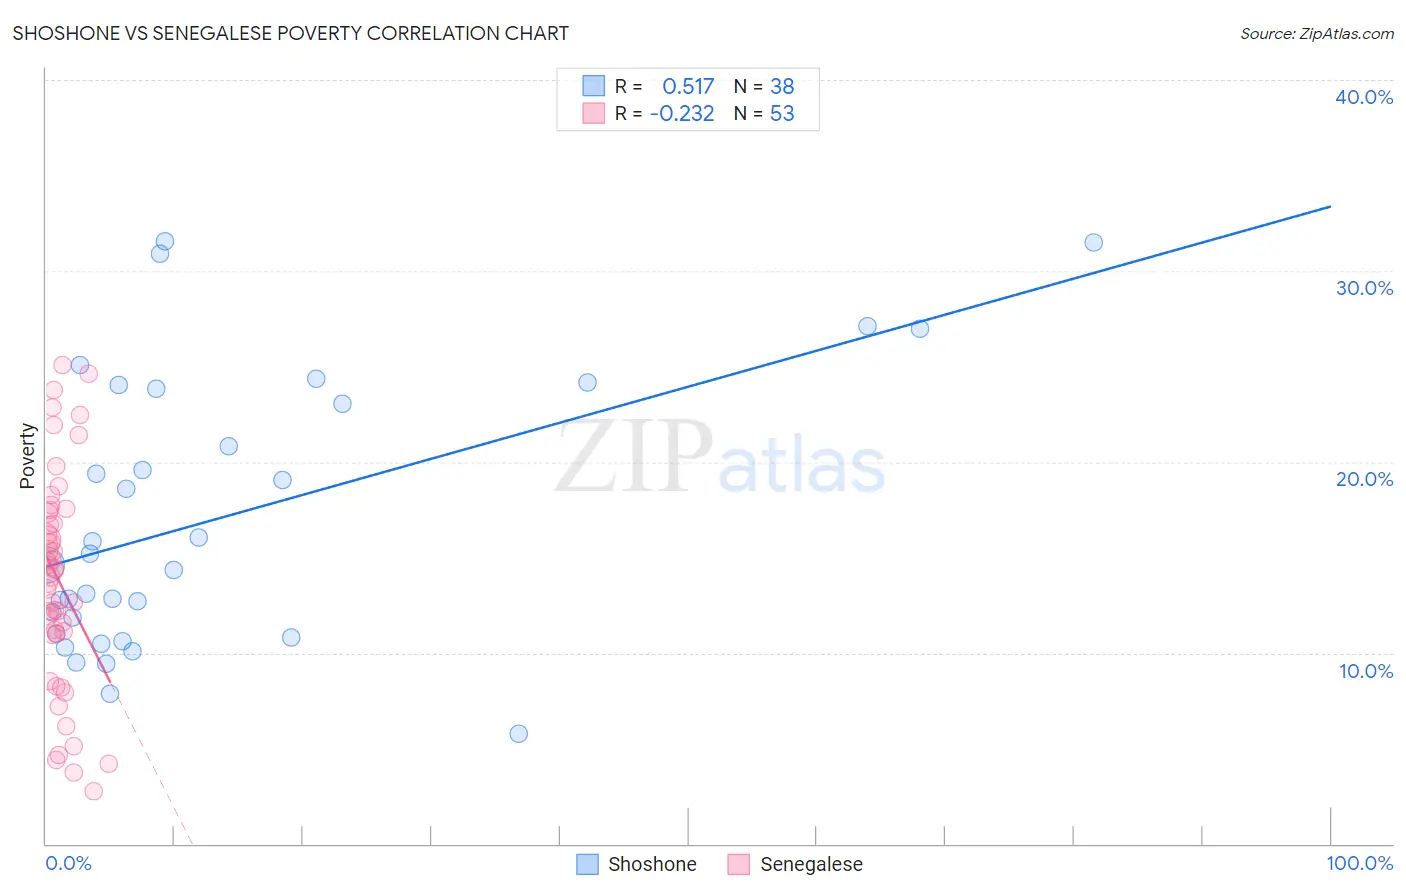
Shoshone vs Senegalese Poverty Correlation Chart
The statistical analysis conducted on geographies consisting of 66,616,342 people shows a substantial positive correlation between the proportion of Shoshone and poverty level in the United States with a correlation coefficient (R) of 0.517 and weighted average of 14.7%. Similarly, the statistical analysis conducted on geographies consisting of 78,114,751 people shows a weak negative correlation between the proportion of Senegalese and poverty level in the United States with a correlation coefficient (R) of -0.232 and weighted average of 15.3%, a difference of 4.4%.
Poverty Correlation Summary
| Measurement | Shoshone | Senegalese |
| Minimum | 5.7% | 2.8% |
| Maximum | 31.5% | 25.1% |
| Range | 25.8% | 22.3% |
| Mean | 17.1% | 13.8% |
| Median | 14.9% | 14.3% |
| Interquartile 25% (IQ1) | 11.0% | 11.0% |
| Interquartile 75% (IQ3) | 23.8% | 17.4% |
| Interquartile Range (IQR) | 12.8% | 6.4% |
| Standard Deviation (Sample) | 7.1% | 5.6% |
| Standard Deviation (Population) | 7.0% | 5.6% |
Similar Demographics by Poverty
Demographics Similar to Shoshone by Poverty
In terms of poverty, the demographic groups most similar to Shoshone are Chickasaw (14.7%, a difference of 0.040%), Central American (14.6%, a difference of 0.58%), Spanish American (14.7%, a difference of 0.58%), Immigrants from Cuba (14.6%, a difference of 0.72%), and Subsaharan African (14.5%, a difference of 0.88%).
| Demographics | Rating | Rank | Poverty |
| Immigrants | Jamaica | 0.1 /100 | #264 | Tragic 14.4% |
| Immigrants | Guyana | 0.1 /100 | #265 | Tragic 14.5% |
| Guyanese | 0.1 /100 | #266 | Tragic 14.5% |
| Iroquois | 0.1 /100 | #267 | Tragic 14.5% |
| Sub-Saharan Africans | 0.1 /100 | #268 | Tragic 14.5% |
| Immigrants | Cuba | 0.1 /100 | #269 | Tragic 14.6% |
| Central Americans | 0.1 /100 | #270 | Tragic 14.6% |
| Shoshone | 0.0 /100 | #271 | Tragic 14.7% |
| Chickasaw | 0.0 /100 | #272 | Tragic 14.7% |
| Spanish Americans | 0.0 /100 | #273 | Tragic 14.7% |
| Barbadians | 0.0 /100 | #274 | Tragic 14.8% |
| Immigrants | West Indies | 0.0 /100 | #275 | Tragic 14.8% |
| Immigrants | Bahamas | 0.0 /100 | #276 | Tragic 14.8% |
| Bangladeshis | 0.0 /100 | #277 | Tragic 14.8% |
| Belizeans | 0.0 /100 | #278 | Tragic 14.8% |
Demographics Similar to Senegalese by Poverty
In terms of poverty, the demographic groups most similar to Senegalese are Immigrants from Senegal (15.3%, a difference of 0.090%), Immigrants from Bangladesh (15.3%, a difference of 0.24%), Hispanic or Latino (15.3%, a difference of 0.29%), Guatemalan (15.3%, a difference of 0.30%), and Immigrants from Central America (15.4%, a difference of 0.38%).
| Demographics | Rating | Rank | Poverty |
| Indonesians | 0.0 /100 | #292 | Tragic 15.1% |
| Immigrants | Zaire | 0.0 /100 | #293 | Tragic 15.1% |
| Blackfeet | 0.0 /100 | #294 | Tragic 15.2% |
| Guatemalans | 0.0 /100 | #295 | Tragic 15.3% |
| Hispanics or Latinos | 0.0 /100 | #296 | Tragic 15.3% |
| Immigrants | Bangladesh | 0.0 /100 | #297 | Tragic 15.3% |
| Immigrants | Senegal | 0.0 /100 | #298 | Tragic 15.3% |
| Senegalese | 0.0 /100 | #299 | Tragic 15.3% |
| Immigrants | Central America | 0.0 /100 | #300 | Tragic 15.4% |
| Bahamians | 0.0 /100 | #301 | Tragic 15.4% |
| Somalis | 0.0 /100 | #302 | Tragic 15.4% |
| Immigrants | Caribbean | 0.0 /100 | #303 | Tragic 15.5% |
| Immigrants | Mexico | 0.0 /100 | #304 | Tragic 15.5% |
| Immigrants | Guatemala | 0.0 /100 | #305 | Tragic 15.5% |
| Creek | 0.0 /100 | #306 | Tragic 15.6% |