Immigrants from Sri Lanka vs Alsatian Poverty
COMPARE
Immigrants from Sri Lanka
Alsatian
Poverty
Poverty Comparison
Immigrants from Sri Lanka
Alsatians
11.2%
POVERTY
97.9/ 100
METRIC RATING
60th/ 347
METRIC RANK
13.4%
POVERTY
2.6/ 100
METRIC RATING
221st/ 347
METRIC RANK
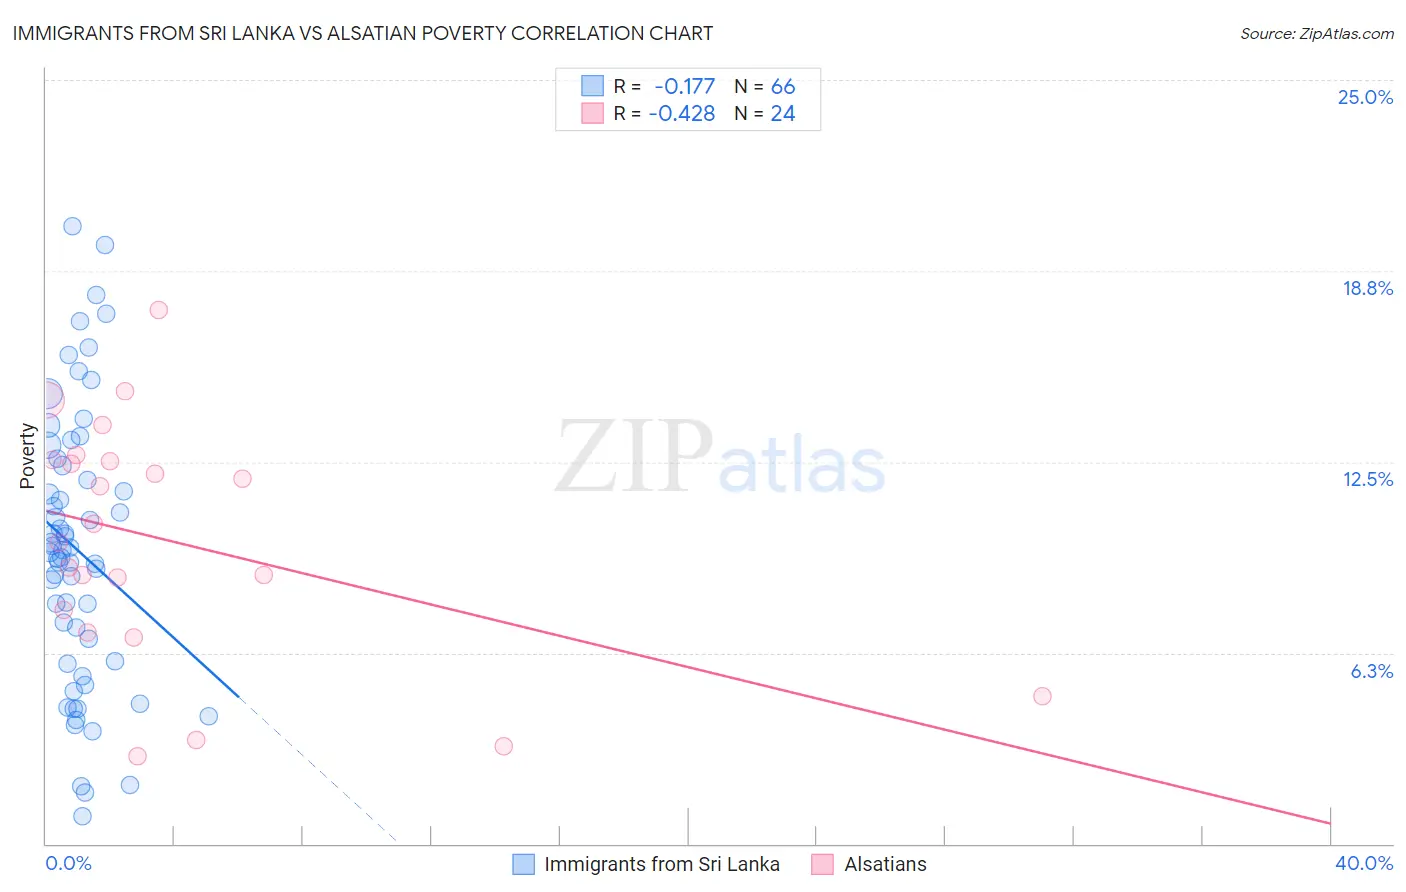
Immigrants from Sri Lanka vs Alsatian Poverty Correlation Chart
The statistical analysis conducted on geographies consisting of 149,683,532 people shows a poor negative correlation between the proportion of Immigrants from Sri Lanka and poverty level in the United States with a correlation coefficient (R) of -0.177 and weighted average of 11.2%. Similarly, the statistical analysis conducted on geographies consisting of 82,679,902 people shows a moderate negative correlation between the proportion of Alsatians and poverty level in the United States with a correlation coefficient (R) of -0.428 and weighted average of 13.4%, a difference of 19.9%.
Poverty Correlation Summary
| Measurement | Immigrants from Sri Lanka | Alsatian |
| Minimum | 0.89% | 2.9% |
| Maximum | 20.2% | 17.5% |
| Range | 19.3% | 14.6% |
| Mean | 9.6% | 9.9% |
| Median | 9.6% | 10.2% |
| Interquartile 25% (IQ1) | 6.0% | 7.3% |
| Interquartile 75% (IQ3) | 12.4% | 12.5% |
| Interquartile Range (IQR) | 6.4% | 5.2% |
| Standard Deviation (Sample) | 4.5% | 3.9% |
| Standard Deviation (Population) | 4.4% | 3.8% |
Similar Demographics by Poverty
Demographics Similar to Immigrants from Sri Lanka by Poverty
In terms of poverty, the demographic groups most similar to Immigrants from Sri Lanka are Immigrants from Italy (11.2%, a difference of 0.060%), Austrian (11.2%, a difference of 0.10%), Ukrainian (11.2%, a difference of 0.10%), Immigrants from Europe (11.2%, a difference of 0.16%), and German (11.1%, a difference of 0.31%).
| Demographics | Rating | Rank | Poverty |
| Immigrants | Austria | 98.6 /100 | #53 | Exceptional 11.1% |
| Immigrants | Bulgaria | 98.5 /100 | #54 | Exceptional 11.1% |
| Immigrants | Serbia | 98.5 /100 | #55 | Exceptional 11.1% |
| Estonians | 98.2 /100 | #56 | Exceptional 11.1% |
| Scandinavians | 98.2 /100 | #57 | Exceptional 11.1% |
| Germans | 98.1 /100 | #58 | Exceptional 11.1% |
| Immigrants | Europe | 98.0 /100 | #59 | Exceptional 11.2% |
| Immigrants | Sri Lanka | 97.9 /100 | #60 | Exceptional 11.2% |
| Immigrants | Italy | 97.9 /100 | #61 | Exceptional 11.2% |
| Austrians | 97.8 /100 | #62 | Exceptional 11.2% |
| Ukrainians | 97.8 /100 | #63 | Exceptional 11.2% |
| Swiss | 97.7 /100 | #64 | Exceptional 11.2% |
| Immigrants | Asia | 97.5 /100 | #65 | Exceptional 11.2% |
| Immigrants | Netherlands | 97.5 /100 | #66 | Exceptional 11.2% |
| Immigrants | Australia | 97.4 /100 | #67 | Exceptional 11.2% |
Demographics Similar to Alsatians by Poverty
In terms of poverty, the demographic groups most similar to Alsatians are Immigrants from Micronesia (13.4%, a difference of 0.040%), Immigrants from Africa (13.4%, a difference of 0.080%), Immigrants from Eritrea (13.4%, a difference of 0.18%), American (13.4%, a difference of 0.20%), and Immigrants from Cambodia (13.4%, a difference of 0.29%).
| Demographics | Rating | Rank | Poverty |
| Bermudans | 3.7 /100 | #214 | Tragic 13.3% |
| Japanese | 3.3 /100 | #215 | Tragic 13.3% |
| Immigrants | Nonimmigrants | 3.3 /100 | #216 | Tragic 13.3% |
| Immigrants | Uzbekistan | 3.2 /100 | #217 | Tragic 13.3% |
| Immigrants | Thailand | 3.1 /100 | #218 | Tragic 13.3% |
| Immigrants | Cambodia | 3.0 /100 | #219 | Tragic 13.4% |
| Americans | 2.9 /100 | #220 | Tragic 13.4% |
| Alsatians | 2.6 /100 | #221 | Tragic 13.4% |
| Immigrants | Micronesia | 2.6 /100 | #222 | Tragic 13.4% |
| Immigrants | Africa | 2.5 /100 | #223 | Tragic 13.4% |
| Immigrants | Eritrea | 2.4 /100 | #224 | Tragic 13.4% |
| German Russians | 2.2 /100 | #225 | Tragic 13.4% |
| Marshallese | 2.2 /100 | #226 | Tragic 13.4% |
| Alaska Natives | 2.1 /100 | #227 | Tragic 13.5% |
| Immigrants | Nigeria | 1.7 /100 | #228 | Tragic 13.5% |