Shoshone vs Alsatian Single Mother Households
COMPARE
Shoshone
Alsatian
Single Mother Households
Single Mother Households Comparison
Shoshone
Alsatians
6.8%
SINGLE MOTHER HOUSEHOLDS
5.7/ 100
METRIC RATING
215th/ 347
METRIC RANK
6.2%
SINGLE MOTHER HOUSEHOLDS
68.7/ 100
METRIC RATING
163rd/ 347
METRIC RANK
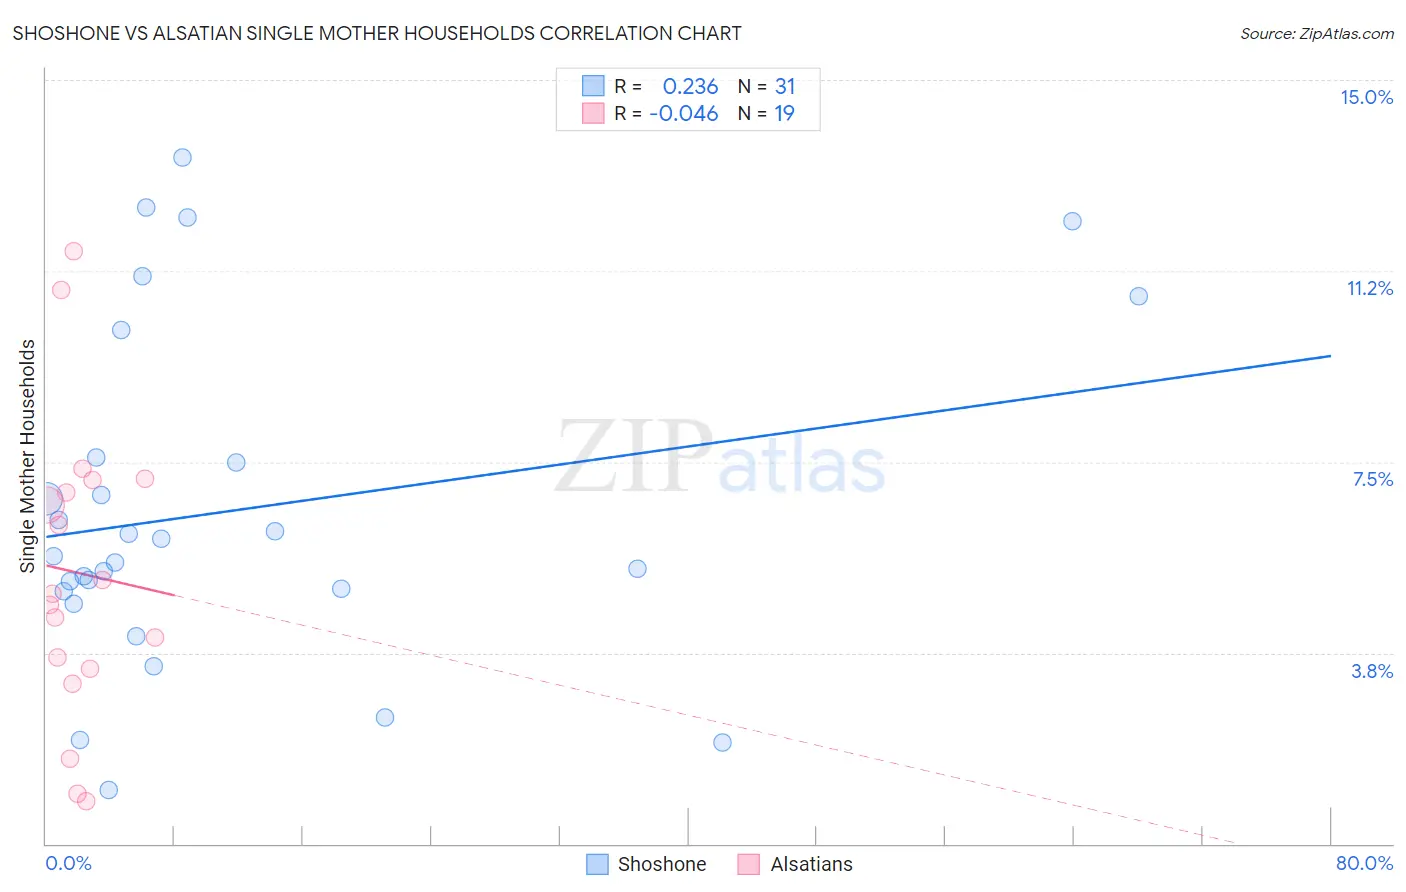
Shoshone vs Alsatian Single Mother Households Correlation Chart
The statistical analysis conducted on geographies consisting of 66,546,675 people shows a weak positive correlation between the proportion of Shoshone and percentage of single mother households in the United States with a correlation coefficient (R) of 0.236 and weighted average of 6.8%. Similarly, the statistical analysis conducted on geographies consisting of 82,530,360 people shows no correlation between the proportion of Alsatians and percentage of single mother households in the United States with a correlation coefficient (R) of -0.046 and weighted average of 6.2%, a difference of 10.1%.
Single Mother Households Correlation Summary
| Measurement | Shoshone | Alsatian |
| Minimum | 1.1% | 0.84% |
| Maximum | 13.5% | 11.6% |
| Range | 12.4% | 10.8% |
| Mean | 6.6% | 5.3% |
| Median | 5.6% | 4.9% |
| Interquartile 25% (IQ1) | 5.0% | 3.4% |
| Interquartile 75% (IQ3) | 7.6% | 7.1% |
| Interquartile Range (IQR) | 2.6% | 3.7% |
| Standard Deviation (Sample) | 3.3% | 2.9% |
| Standard Deviation (Population) | 3.2% | 2.8% |
Similar Demographics by Single Mother Households
Demographics Similar to Shoshone by Single Mother Households
In terms of single mother households, the demographic groups most similar to Shoshone are Cherokee (6.8%, a difference of 0.29%), Aleut (6.8%, a difference of 0.44%), Immigrants from Eastern Africa (6.8%, a difference of 0.65%), Immigrants (6.8%, a difference of 0.74%), and Immigrants from Uruguay (6.7%, a difference of 0.91%).
| Demographics | Rating | Rank | Single Mother Households |
| Vietnamese | 11.3 /100 | #208 | Poor 6.7% |
| Immigrants | Colombia | 10.5 /100 | #209 | Poor 6.7% |
| Immigrants | Nonimmigrants | 10.4 /100 | #210 | Poor 6.7% |
| Immigrants | Venezuela | 8.5 /100 | #211 | Tragic 6.7% |
| Immigrants | Eritrea | 8.4 /100 | #212 | Tragic 6.7% |
| Immigrants | Costa Rica | 8.2 /100 | #213 | Tragic 6.7% |
| Immigrants | Uruguay | 7.9 /100 | #214 | Tragic 6.7% |
| Shoshone | 5.7 /100 | #215 | Tragic 6.8% |
| Cherokee | 5.1 /100 | #216 | Tragic 6.8% |
| Aleuts | 4.8 /100 | #217 | Tragic 6.8% |
| Immigrants | Eastern Africa | 4.4 /100 | #218 | Tragic 6.8% |
| Immigrants | Immigrants | 4.3 /100 | #219 | Tragic 6.8% |
| Immigrants | Thailand | 4.0 /100 | #220 | Tragic 6.9% |
| French American Indians | 3.7 /100 | #221 | Tragic 6.9% |
| Immigrants | Bangladesh | 3.7 /100 | #222 | Tragic 6.9% |
Demographics Similar to Alsatians by Single Mother Households
In terms of single mother households, the demographic groups most similar to Alsatians are Immigrants from Northern Africa (6.2%, a difference of 0.090%), Immigrants from Zimbabwe (6.2%, a difference of 0.16%), Immigrants from Syria (6.2%, a difference of 0.16%), Immigrants from Germany (6.1%, a difference of 0.51%), and Iraqi (6.1%, a difference of 0.59%).
| Demographics | Rating | Rank | Single Mother Households |
| Native Hawaiians | 75.0 /100 | #156 | Good 6.1% |
| Chileans | 74.2 /100 | #157 | Good 6.1% |
| Celtics | 73.3 /100 | #158 | Good 6.1% |
| Yugoslavians | 73.1 /100 | #159 | Good 6.1% |
| Iraqis | 73.0 /100 | #160 | Good 6.1% |
| Immigrants | Germany | 72.4 /100 | #161 | Good 6.1% |
| Immigrants | Zimbabwe | 69.9 /100 | #162 | Good 6.2% |
| Alsatians | 68.7 /100 | #163 | Good 6.2% |
| Immigrants | Northern Africa | 68.0 /100 | #164 | Good 6.2% |
| Immigrants | Syria | 67.4 /100 | #165 | Good 6.2% |
| Sri Lankans | 63.9 /100 | #166 | Good 6.2% |
| Brazilians | 59.1 /100 | #167 | Average 6.2% |
| Immigrants | Chile | 58.3 /100 | #168 | Average 6.3% |
| Puget Sound Salish | 58.1 /100 | #169 | Average 6.3% |
| Immigrants | Oceania | 54.6 /100 | #170 | Average 6.3% |