Shoshone vs Alsatian College, Under 1 year
COMPARE
Shoshone
Alsatian
College, Under 1 year
College, Under 1 year Comparison
Shoshone
Alsatians
61.1%
COLLEGE, UNDER 1 YEAR
0.2/ 100
METRIC RATING
263rd/ 347
METRIC RANK
67.1%
COLLEGE, UNDER 1 YEAR
91.3/ 100
METRIC RATING
126th/ 347
METRIC RANK
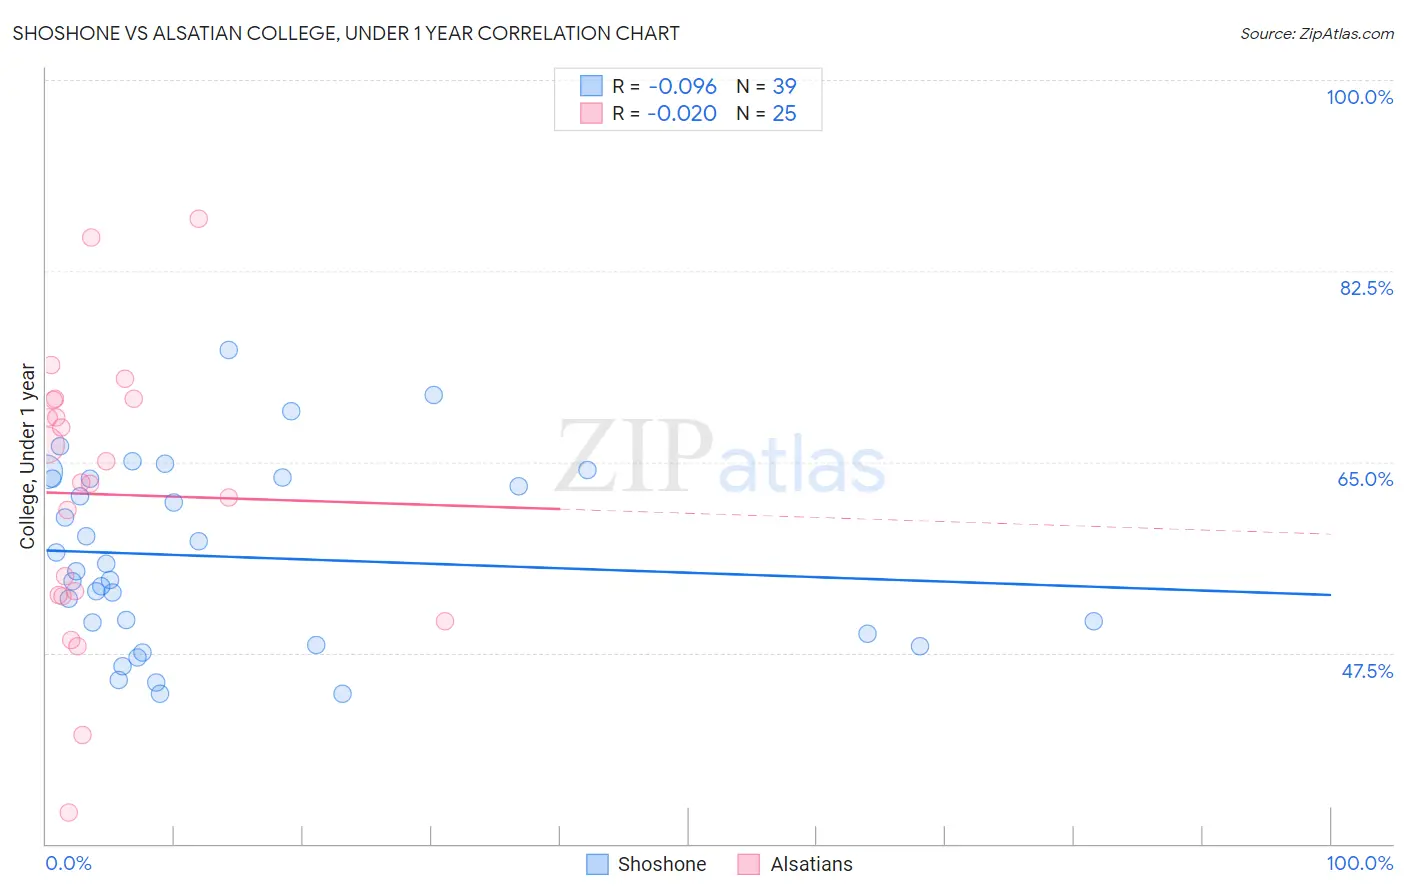
Shoshone vs Alsatian College, Under 1 year Correlation Chart
The statistical analysis conducted on geographies consisting of 66,627,303 people shows a slight negative correlation between the proportion of Shoshone and percentage of population with at least college, under 1 year education in the United States with a correlation coefficient (R) of -0.096 and weighted average of 61.1%. Similarly, the statistical analysis conducted on geographies consisting of 82,682,365 people shows no correlation between the proportion of Alsatians and percentage of population with at least college, under 1 year education in the United States with a correlation coefficient (R) of -0.020 and weighted average of 67.1%, a difference of 9.8%.
College, Under 1 year Correlation Summary
| Measurement | Shoshone | Alsatian |
| Minimum | 43.7% | 32.9% |
| Maximum | 75.3% | 87.3% |
| Range | 31.6% | 54.4% |
| Mean | 56.3% | 62.0% |
| Median | 55.0% | 63.1% |
| Interquartile 25% (IQ1) | 49.3% | 52.8% |
| Interquartile 75% (IQ3) | 63.5% | 70.7% |
| Interquartile Range (IQR) | 14.2% | 17.9% |
| Standard Deviation (Sample) | 8.2% | 12.9% |
| Standard Deviation (Population) | 8.1% | 12.6% |
Similar Demographics by College, Under 1 year
Demographics Similar to Shoshone by College, Under 1 year
In terms of college, under 1 year, the demographic groups most similar to Shoshone are Barbadian (61.1%, a difference of 0.010%), African (61.1%, a difference of 0.050%), Trinidadian and Tobagonian (61.1%, a difference of 0.060%), Immigrants from Bahamas (61.1%, a difference of 0.060%), and Blackfeet (61.1%, a difference of 0.070%).
| Demographics | Rating | Rank | College, Under 1 year |
| Bangladeshis | 0.4 /100 | #256 | Tragic 61.4% |
| Immigrants | Laos | 0.3 /100 | #257 | Tragic 61.3% |
| Immigrants | Bangladesh | 0.3 /100 | #258 | Tragic 61.3% |
| Indonesians | 0.3 /100 | #259 | Tragic 61.2% |
| Blackfeet | 0.3 /100 | #260 | Tragic 61.1% |
| Africans | 0.3 /100 | #261 | Tragic 61.1% |
| Barbadians | 0.2 /100 | #262 | Tragic 61.1% |
| Shoshone | 0.2 /100 | #263 | Tragic 61.1% |
| Trinidadians and Tobagonians | 0.2 /100 | #264 | Tragic 61.1% |
| Immigrants | Bahamas | 0.2 /100 | #265 | Tragic 61.1% |
| Alaskan Athabascans | 0.2 /100 | #266 | Tragic 61.0% |
| Americans | 0.2 /100 | #267 | Tragic 61.0% |
| Immigrants | Trinidad and Tobago | 0.1 /100 | #268 | Tragic 60.7% |
| Immigrants | West Indies | 0.1 /100 | #269 | Tragic 60.6% |
| Cheyenne | 0.1 /100 | #270 | Tragic 60.6% |
Demographics Similar to Alsatians by College, Under 1 year
In terms of college, under 1 year, the demographic groups most similar to Alsatians are Italian (67.2%, a difference of 0.060%), Czech (67.1%, a difference of 0.080%), Scottish (67.0%, a difference of 0.14%), Arab (67.2%, a difference of 0.18%), and Immigrants from Northern Africa (67.2%, a difference of 0.19%).
| Demographics | Rating | Rank | College, Under 1 year |
| Lebanese | 94.6 /100 | #119 | Exceptional 67.5% |
| Serbians | 93.9 /100 | #120 | Exceptional 67.4% |
| Slovenes | 93.3 /100 | #121 | Exceptional 67.3% |
| Immigrants | Jordan | 92.8 /100 | #122 | Exceptional 67.3% |
| Immigrants | Northern Africa | 92.7 /100 | #123 | Exceptional 67.2% |
| Arabs | 92.6 /100 | #124 | Exceptional 67.2% |
| Italians | 91.8 /100 | #125 | Exceptional 67.2% |
| Alsatians | 91.3 /100 | #126 | Exceptional 67.1% |
| Czechs | 90.8 /100 | #127 | Exceptional 67.1% |
| Scottish | 90.2 /100 | #128 | Exceptional 67.0% |
| Immigrants | Eastern Africa | 89.5 /100 | #129 | Excellent 67.0% |
| Immigrants | Syria | 89.0 /100 | #130 | Excellent 66.9% |
| Finns | 88.6 /100 | #131 | Excellent 66.9% |
| Poles | 88.4 /100 | #132 | Excellent 66.9% |
| Immigrants | Brazil | 88.3 /100 | #133 | Excellent 66.9% |