Serbian vs Navajo Child Poverty Among Girls Under 16
COMPARE
Serbian
Navajo
Child Poverty Among Girls Under 16
Child Poverty Among Girls Under 16 Comparison
Serbians
Navajo
15.1%
CHILD POVERTY AMONG GIRLS UNDER 16
94.8/ 100
METRIC RATING
109th/ 347
METRIC RANK
30.5%
CHILD POVERTY AMONG GIRLS UNDER 16
0.0/ 100
METRIC RATING
344th/ 347
METRIC RANK
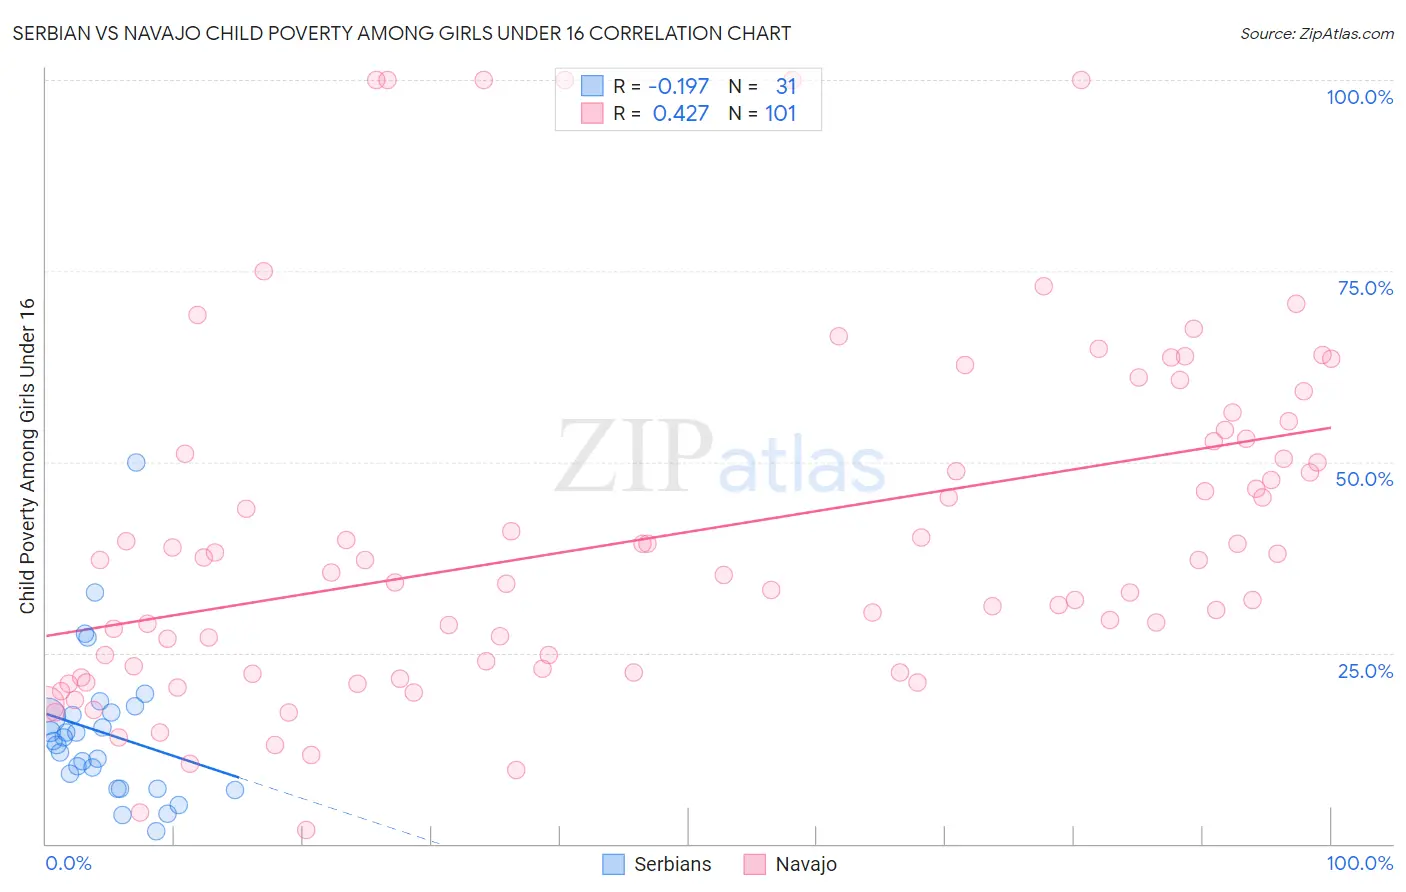
Serbian vs Navajo Child Poverty Among Girls Under 16 Correlation Chart
The statistical analysis conducted on geographies consisting of 263,517,669 people shows a poor negative correlation between the proportion of Serbians and poverty level among girls under the age of 16 in the United States with a correlation coefficient (R) of -0.197 and weighted average of 15.1%. Similarly, the statistical analysis conducted on geographies consisting of 223,292,374 people shows a moderate positive correlation between the proportion of Navajo and poverty level among girls under the age of 16 in the United States with a correlation coefficient (R) of 0.427 and weighted average of 30.5%, a difference of 101.9%.
Child Poverty Among Girls Under 16 Correlation Summary
| Measurement | Serbian | Navajo |
| Minimum | 1.6% | 1.8% |
| Maximum | 50.0% | 100.0% |
| Range | 48.4% | 98.2% |
| Mean | 14.5% | 40.4% |
| Median | 13.4% | 37.1% |
| Interquartile 25% (IQ1) | 7.2% | 22.7% |
| Interquartile 75% (IQ3) | 17.1% | 52.8% |
| Interquartile Range (IQR) | 9.9% | 30.1% |
| Standard Deviation (Sample) | 9.7% | 22.5% |
| Standard Deviation (Population) | 9.5% | 22.4% |
Similar Demographics by Child Poverty Among Girls Under 16
Demographics Similar to Serbians by Child Poverty Among Girls Under 16
In terms of child poverty among girls under 16, the demographic groups most similar to Serbians are Immigrants from Brazil (15.1%, a difference of 0.080%), Immigrants from Croatia (15.1%, a difference of 0.12%), Immigrants from Ukraine (15.1%, a difference of 0.16%), Palestinian (15.1%, a difference of 0.16%), and Chilean (15.1%, a difference of 0.22%).
| Demographics | Rating | Rank | Child Poverty Among Girls Under 16 |
| Immigrants | Malaysia | 95.6 /100 | #102 | Exceptional 15.0% |
| British | 95.6 /100 | #103 | Exceptional 15.0% |
| Romanians | 95.3 /100 | #104 | Exceptional 15.0% |
| Immigrants | England | 95.1 /100 | #105 | Exceptional 15.1% |
| Chileans | 95.1 /100 | #106 | Exceptional 15.1% |
| Immigrants | Ukraine | 95.0 /100 | #107 | Exceptional 15.1% |
| Immigrants | Brazil | 94.9 /100 | #108 | Exceptional 15.1% |
| Serbians | 94.8 /100 | #109 | Exceptional 15.1% |
| Immigrants | Croatia | 94.6 /100 | #110 | Exceptional 15.1% |
| Palestinians | 94.5 /100 | #111 | Exceptional 15.1% |
| Immigrants | Kazakhstan | 94.3 /100 | #112 | Exceptional 15.1% |
| Dutch | 94.3 /100 | #113 | Exceptional 15.1% |
| Sri Lankans | 94.0 /100 | #114 | Exceptional 15.2% |
| Belgians | 93.9 /100 | #115 | Exceptional 15.2% |
| Immigrants | Denmark | 93.3 /100 | #116 | Exceptional 15.2% |
Demographics Similar to Navajo by Child Poverty Among Girls Under 16
In terms of child poverty among girls under 16, the demographic groups most similar to Navajo are Lumbee (30.7%, a difference of 0.78%), Immigrants from Yemen (29.5%, a difference of 3.3%), Tohono O'odham (31.6%, a difference of 3.7%), Puerto Rican (32.7%, a difference of 7.2%), and Pima (28.2%, a difference of 8.0%).
| Demographics | Rating | Rank | Child Poverty Among Girls Under 16 |
| Blacks/African Americans | 0.0 /100 | #333 | Tragic 24.7% |
| Menominee | 0.0 /100 | #334 | Tragic 25.0% |
| Pueblo | 0.0 /100 | #335 | Tragic 25.2% |
| Sioux | 0.0 /100 | #336 | Tragic 25.6% |
| Yup'ik | 0.0 /100 | #337 | Tragic 25.8% |
| Cheyenne | 0.0 /100 | #338 | Tragic 26.3% |
| Crow | 0.0 /100 | #339 | Tragic 26.4% |
| Yuman | 0.0 /100 | #340 | Tragic 27.1% |
| Hopi | 0.0 /100 | #341 | Tragic 27.9% |
| Pima | 0.0 /100 | #342 | Tragic 28.2% |
| Immigrants | Yemen | 0.0 /100 | #343 | Tragic 29.5% |
| Navajo | 0.0 /100 | #344 | Tragic 30.5% |
| Lumbee | 0.0 /100 | #345 | Tragic 30.7% |
| Tohono O'odham | 0.0 /100 | #346 | Tragic 31.6% |
| Puerto Ricans | 0.0 /100 | #347 | Tragic 32.7% |