Immigrants from North Macedonia vs Navajo Child Poverty Among Girls Under 16
COMPARE
Immigrants from North Macedonia
Navajo
Child Poverty Among Girls Under 16
Child Poverty Among Girls Under 16 Comparison
Immigrants from North Macedonia
Navajo
15.2%
CHILD POVERTY AMONG GIRLS UNDER 16
93.1/ 100
METRIC RATING
117th/ 347
METRIC RANK
30.5%
CHILD POVERTY AMONG GIRLS UNDER 16
0.0/ 100
METRIC RATING
344th/ 347
METRIC RANK
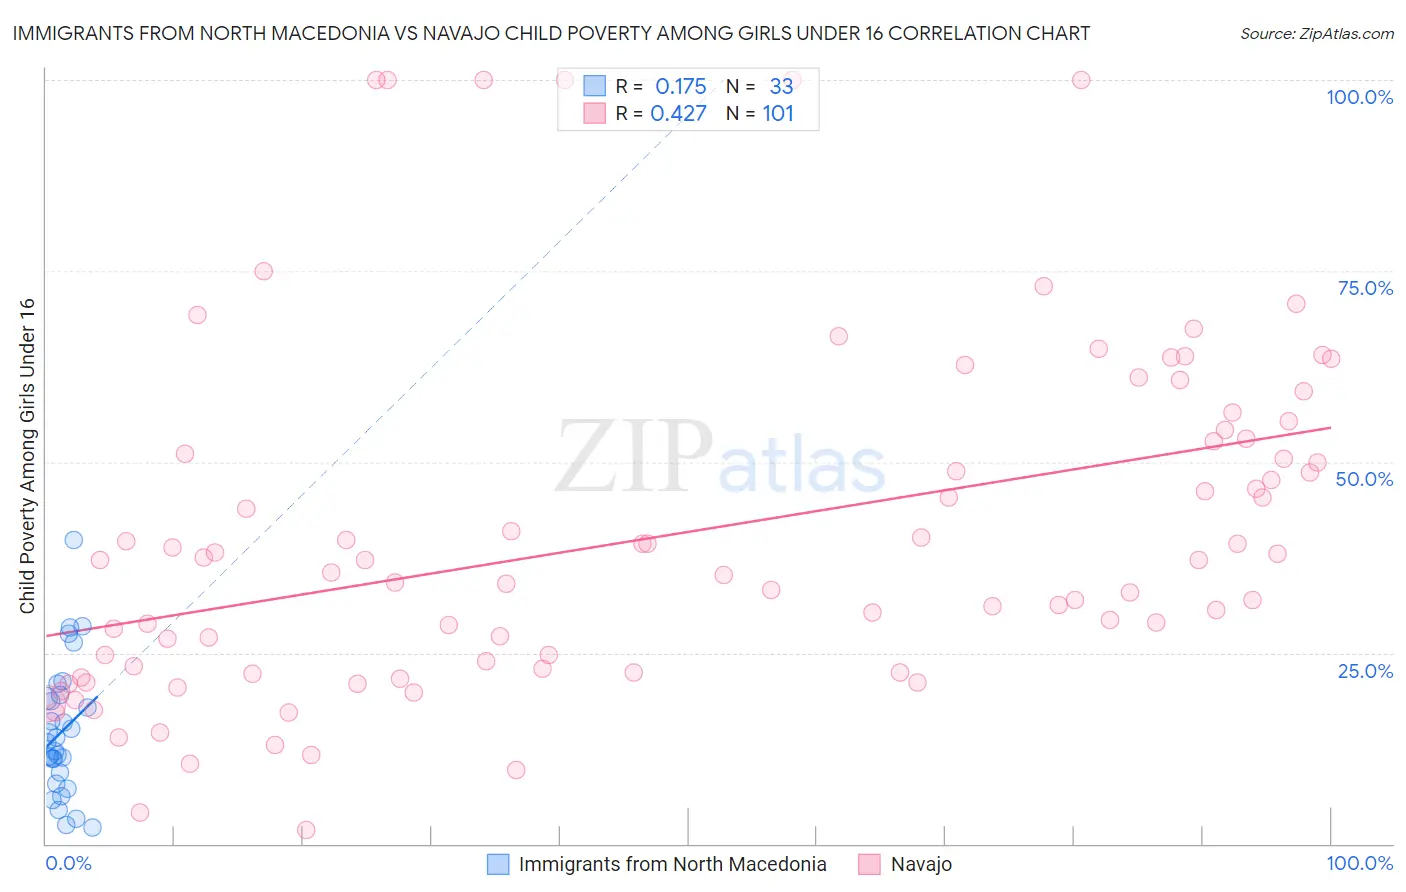
Immigrants from North Macedonia vs Navajo Child Poverty Among Girls Under 16 Correlation Chart
The statistical analysis conducted on geographies consisting of 73,617,729 people shows a poor positive correlation between the proportion of Immigrants from North Macedonia and poverty level among girls under the age of 16 in the United States with a correlation coefficient (R) of 0.175 and weighted average of 15.2%. Similarly, the statistical analysis conducted on geographies consisting of 223,292,374 people shows a moderate positive correlation between the proportion of Navajo and poverty level among girls under the age of 16 in the United States with a correlation coefficient (R) of 0.427 and weighted average of 30.5%, a difference of 100.0%.
Child Poverty Among Girls Under 16 Correlation Summary
| Measurement | Immigrants from North Macedonia | Navajo |
| Minimum | 2.1% | 1.8% |
| Maximum | 39.8% | 100.0% |
| Range | 37.6% | 98.2% |
| Mean | 14.7% | 40.4% |
| Median | 13.3% | 37.1% |
| Interquartile 25% (IQ1) | 8.6% | 22.7% |
| Interquartile 75% (IQ3) | 19.3% | 52.8% |
| Interquartile Range (IQR) | 10.7% | 30.1% |
| Standard Deviation (Sample) | 8.6% | 22.5% |
| Standard Deviation (Population) | 8.5% | 22.4% |
Similar Demographics by Child Poverty Among Girls Under 16
Demographics Similar to Immigrants from North Macedonia by Child Poverty Among Girls Under 16
In terms of child poverty among girls under 16, the demographic groups most similar to Immigrants from North Macedonia are Immigrants from Denmark (15.2%, a difference of 0.090%), Immigrants from Southern Europe (15.3%, a difference of 0.18%), Immigrants from Zimbabwe (15.3%, a difference of 0.29%), Pakistani (15.3%, a difference of 0.38%), and English (15.3%, a difference of 0.40%).
| Demographics | Rating | Rank | Child Poverty Among Girls Under 16 |
| Immigrants | Croatia | 94.6 /100 | #110 | Exceptional 15.1% |
| Palestinians | 94.5 /100 | #111 | Exceptional 15.1% |
| Immigrants | Kazakhstan | 94.3 /100 | #112 | Exceptional 15.1% |
| Dutch | 94.3 /100 | #113 | Exceptional 15.1% |
| Sri Lankans | 94.0 /100 | #114 | Exceptional 15.2% |
| Belgians | 93.9 /100 | #115 | Exceptional 15.2% |
| Immigrants | Denmark | 93.3 /100 | #116 | Exceptional 15.2% |
| Immigrants | North Macedonia | 93.1 /100 | #117 | Exceptional 15.2% |
| Immigrants | Southern Europe | 92.7 /100 | #118 | Exceptional 15.3% |
| Immigrants | Zimbabwe | 92.5 /100 | #119 | Exceptional 15.3% |
| Pakistanis | 92.3 /100 | #120 | Exceptional 15.3% |
| English | 92.2 /100 | #121 | Exceptional 15.3% |
| Portuguese | 91.8 /100 | #122 | Exceptional 15.3% |
| Irish | 91.5 /100 | #123 | Exceptional 15.3% |
| Carpatho Rusyns | 91.4 /100 | #124 | Exceptional 15.3% |
Demographics Similar to Navajo by Child Poverty Among Girls Under 16
In terms of child poverty among girls under 16, the demographic groups most similar to Navajo are Lumbee (30.7%, a difference of 0.78%), Immigrants from Yemen (29.5%, a difference of 3.3%), Tohono O'odham (31.6%, a difference of 3.7%), Puerto Rican (32.7%, a difference of 7.2%), and Pima (28.2%, a difference of 8.0%).
| Demographics | Rating | Rank | Child Poverty Among Girls Under 16 |
| Blacks/African Americans | 0.0 /100 | #333 | Tragic 24.7% |
| Menominee | 0.0 /100 | #334 | Tragic 25.0% |
| Pueblo | 0.0 /100 | #335 | Tragic 25.2% |
| Sioux | 0.0 /100 | #336 | Tragic 25.6% |
| Yup'ik | 0.0 /100 | #337 | Tragic 25.8% |
| Cheyenne | 0.0 /100 | #338 | Tragic 26.3% |
| Crow | 0.0 /100 | #339 | Tragic 26.4% |
| Yuman | 0.0 /100 | #340 | Tragic 27.1% |
| Hopi | 0.0 /100 | #341 | Tragic 27.9% |
| Pima | 0.0 /100 | #342 | Tragic 28.2% |
| Immigrants | Yemen | 0.0 /100 | #343 | Tragic 29.5% |
| Navajo | 0.0 /100 | #344 | Tragic 30.5% |
| Lumbee | 0.0 /100 | #345 | Tragic 30.7% |
| Tohono O'odham | 0.0 /100 | #346 | Tragic 31.6% |
| Puerto Ricans | 0.0 /100 | #347 | Tragic 32.7% |