Serbian vs Chilean Child Poverty Among Girls Under 16
COMPARE
Serbian
Chilean
Child Poverty Among Girls Under 16
Child Poverty Among Girls Under 16 Comparison
Serbians
Chileans
15.1%
CHILD POVERTY AMONG GIRLS UNDER 16
94.8/ 100
METRIC RATING
109th/ 347
METRIC RANK
15.1%
CHILD POVERTY AMONG GIRLS UNDER 16
95.1/ 100
METRIC RATING
106th/ 347
METRIC RANK
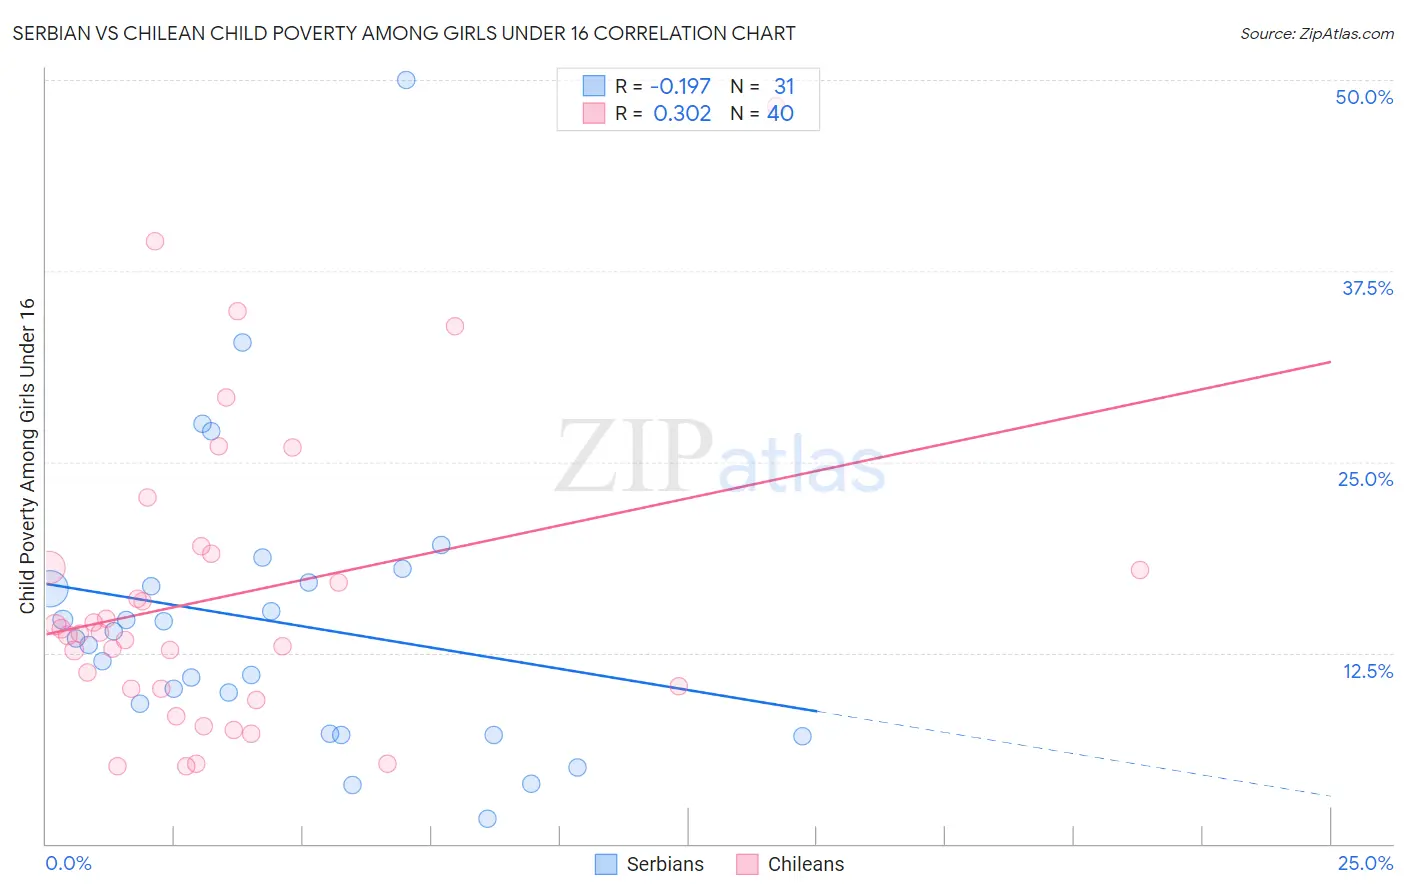
Serbian vs Chilean Child Poverty Among Girls Under 16 Correlation Chart
The statistical analysis conducted on geographies consisting of 263,517,669 people shows a poor negative correlation between the proportion of Serbians and poverty level among girls under the age of 16 in the United States with a correlation coefficient (R) of -0.197 and weighted average of 15.1%. Similarly, the statistical analysis conducted on geographies consisting of 253,944,579 people shows a mild positive correlation between the proportion of Chileans and poverty level among girls under the age of 16 in the United States with a correlation coefficient (R) of 0.302 and weighted average of 15.1%, a difference of 0.22%.
Child Poverty Among Girls Under 16 Correlation Summary
| Measurement | Serbian | Chilean |
| Minimum | 1.6% | 5.1% |
| Maximum | 50.0% | 48.3% |
| Range | 48.4% | 43.2% |
| Mean | 14.5% | 16.2% |
| Median | 13.4% | 13.8% |
| Interquartile 25% (IQ1) | 7.2% | 10.1% |
| Interquartile 75% (IQ3) | 17.1% | 18.6% |
| Interquartile Range (IQR) | 9.9% | 8.4% |
| Standard Deviation (Sample) | 9.7% | 9.7% |
| Standard Deviation (Population) | 9.5% | 9.6% |
Demographics Similar to Serbians and Chileans by Child Poverty Among Girls Under 16
In terms of child poverty among girls under 16, the demographic groups most similar to Serbians are Immigrants from Brazil (15.1%, a difference of 0.080%), Immigrants from Croatia (15.1%, a difference of 0.12%), Immigrants from Ukraine (15.1%, a difference of 0.16%), Palestinian (15.1%, a difference of 0.16%), and Immigrants from England (15.1%, a difference of 0.23%). Similarly, the demographic groups most similar to Chileans are Immigrants from England (15.1%, a difference of 0.010%), Immigrants from Ukraine (15.1%, a difference of 0.060%), Immigrants from Brazil (15.1%, a difference of 0.14%), Romanian (15.0%, a difference of 0.15%), and British (15.0%, a difference of 0.31%).
| Demographics | Rating | Rank | Child Poverty Among Girls Under 16 |
| Immigrants | Latvia | 96.1 /100 | #97 | Exceptional 14.9% |
| Basques | 95.9 /100 | #98 | Exceptional 15.0% |
| Immigrants | Egypt | 95.7 /100 | #99 | Exceptional 15.0% |
| Paraguayans | 95.7 /100 | #100 | Exceptional 15.0% |
| Immigrants | South Africa | 95.6 /100 | #101 | Exceptional 15.0% |
| Immigrants | Malaysia | 95.6 /100 | #102 | Exceptional 15.0% |
| British | 95.6 /100 | #103 | Exceptional 15.0% |
| Romanians | 95.3 /100 | #104 | Exceptional 15.0% |
| Immigrants | England | 95.1 /100 | #105 | Exceptional 15.1% |
| Chileans | 95.1 /100 | #106 | Exceptional 15.1% |
| Immigrants | Ukraine | 95.0 /100 | #107 | Exceptional 15.1% |
| Immigrants | Brazil | 94.9 /100 | #108 | Exceptional 15.1% |
| Serbians | 94.8 /100 | #109 | Exceptional 15.1% |
| Immigrants | Croatia | 94.6 /100 | #110 | Exceptional 15.1% |
| Palestinians | 94.5 /100 | #111 | Exceptional 15.1% |
| Immigrants | Kazakhstan | 94.3 /100 | #112 | Exceptional 15.1% |
| Dutch | 94.3 /100 | #113 | Exceptional 15.1% |
| Sri Lankans | 94.0 /100 | #114 | Exceptional 15.2% |
| Belgians | 93.9 /100 | #115 | Exceptional 15.2% |
| Immigrants | Denmark | 93.3 /100 | #116 | Exceptional 15.2% |
| Immigrants | North Macedonia | 93.1 /100 | #117 | Exceptional 15.2% |