Serbian vs Eastern European Child Poverty Among Girls Under 16
COMPARE
Serbian
Eastern European
Child Poverty Among Girls Under 16
Child Poverty Among Girls Under 16 Comparison
Serbians
Eastern Europeans
15.1%
CHILD POVERTY AMONG GIRLS UNDER 16
94.8/ 100
METRIC RATING
109th/ 347
METRIC RANK
13.5%
CHILD POVERTY AMONG GIRLS UNDER 16
99.8/ 100
METRIC RATING
26th/ 347
METRIC RANK
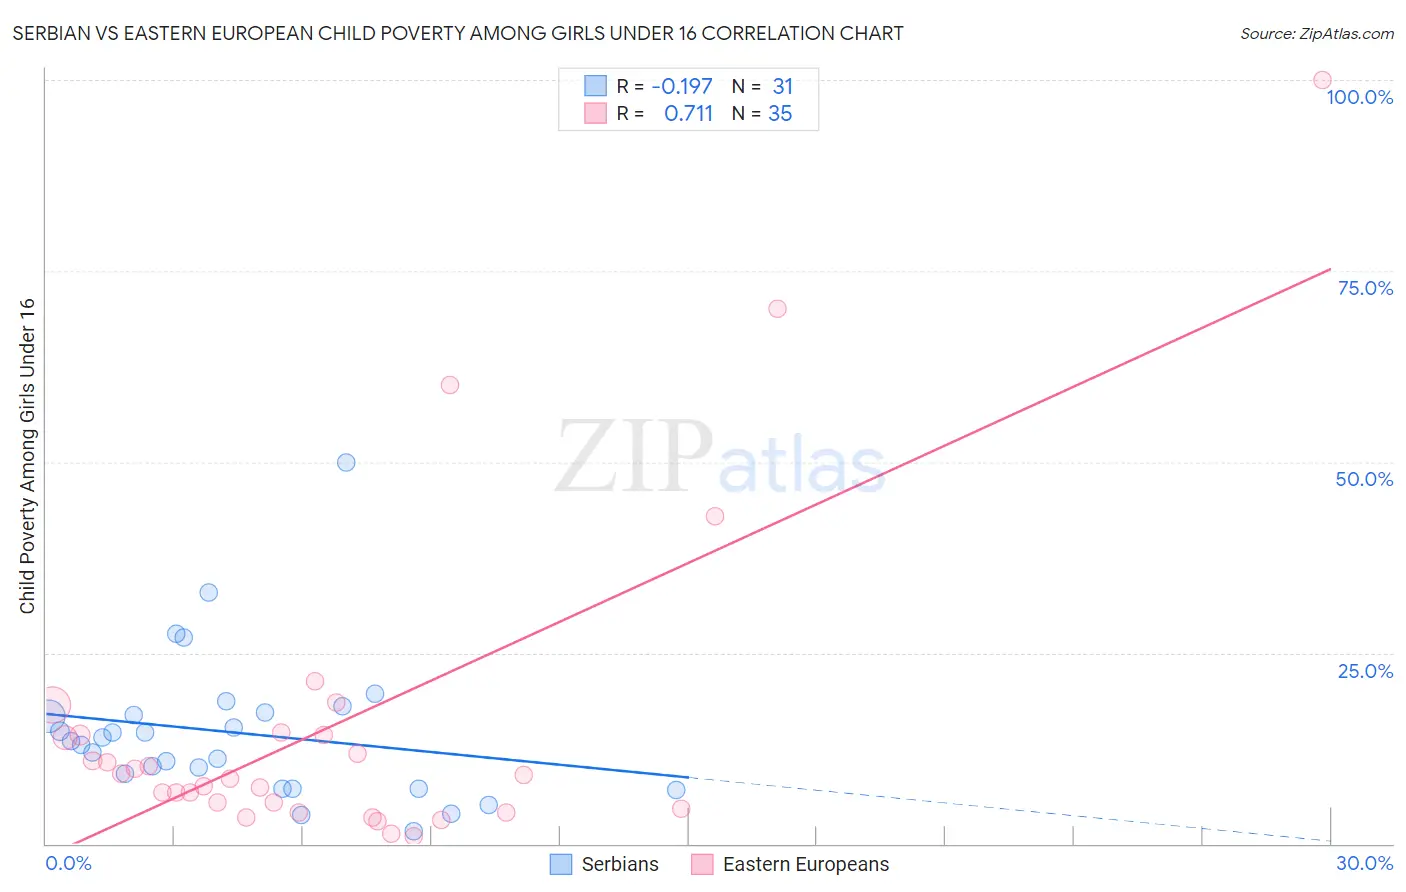
Serbian vs Eastern European Child Poverty Among Girls Under 16 Correlation Chart
The statistical analysis conducted on geographies consisting of 263,517,669 people shows a poor negative correlation between the proportion of Serbians and poverty level among girls under the age of 16 in the United States with a correlation coefficient (R) of -0.197 and weighted average of 15.1%. Similarly, the statistical analysis conducted on geographies consisting of 448,083,832 people shows a strong positive correlation between the proportion of Eastern Europeans and poverty level among girls under the age of 16 in the United States with a correlation coefficient (R) of 0.711 and weighted average of 13.5%, a difference of 11.6%.
Child Poverty Among Girls Under 16 Correlation Summary
| Measurement | Serbian | Eastern European |
| Minimum | 1.6% | 1.0% |
| Maximum | 50.0% | 100.0% |
| Range | 48.4% | 99.0% |
| Mean | 14.5% | 15.5% |
| Median | 13.4% | 9.0% |
| Interquartile 25% (IQ1) | 7.2% | 4.7% |
| Interquartile 75% (IQ3) | 17.1% | 14.3% |
| Interquartile Range (IQR) | 9.9% | 9.6% |
| Standard Deviation (Sample) | 9.7% | 21.1% |
| Standard Deviation (Population) | 9.5% | 20.8% |
Similar Demographics by Child Poverty Among Girls Under 16
Demographics Similar to Serbians by Child Poverty Among Girls Under 16
In terms of child poverty among girls under 16, the demographic groups most similar to Serbians are Immigrants from Brazil (15.1%, a difference of 0.080%), Immigrants from Croatia (15.1%, a difference of 0.12%), Immigrants from Ukraine (15.1%, a difference of 0.16%), Palestinian (15.1%, a difference of 0.16%), and Chilean (15.1%, a difference of 0.22%).
| Demographics | Rating | Rank | Child Poverty Among Girls Under 16 |
| Immigrants | Malaysia | 95.6 /100 | #102 | Exceptional 15.0% |
| British | 95.6 /100 | #103 | Exceptional 15.0% |
| Romanians | 95.3 /100 | #104 | Exceptional 15.0% |
| Immigrants | England | 95.1 /100 | #105 | Exceptional 15.1% |
| Chileans | 95.1 /100 | #106 | Exceptional 15.1% |
| Immigrants | Ukraine | 95.0 /100 | #107 | Exceptional 15.1% |
| Immigrants | Brazil | 94.9 /100 | #108 | Exceptional 15.1% |
| Serbians | 94.8 /100 | #109 | Exceptional 15.1% |
| Immigrants | Croatia | 94.6 /100 | #110 | Exceptional 15.1% |
| Palestinians | 94.5 /100 | #111 | Exceptional 15.1% |
| Immigrants | Kazakhstan | 94.3 /100 | #112 | Exceptional 15.1% |
| Dutch | 94.3 /100 | #113 | Exceptional 15.1% |
| Sri Lankans | 94.0 /100 | #114 | Exceptional 15.2% |
| Belgians | 93.9 /100 | #115 | Exceptional 15.2% |
| Immigrants | Denmark | 93.3 /100 | #116 | Exceptional 15.2% |
Demographics Similar to Eastern Europeans by Child Poverty Among Girls Under 16
In terms of child poverty among girls under 16, the demographic groups most similar to Eastern Europeans are Latvian (13.5%, a difference of 0.020%), Tongan (13.6%, a difference of 0.28%), Bolivian (13.6%, a difference of 0.40%), Immigrants from China (13.4%, a difference of 0.78%), and Asian (13.7%, a difference of 1.1%).
| Demographics | Rating | Rank | Child Poverty Among Girls Under 16 |
| Cypriots | 99.9 /100 | #19 | Exceptional 13.2% |
| Immigrants | Japan | 99.9 /100 | #20 | Exceptional 13.3% |
| Assyrians/Chaldeans/Syriacs | 99.9 /100 | #21 | Exceptional 13.3% |
| Indians (Asian) | 99.9 /100 | #22 | Exceptional 13.3% |
| Norwegians | 99.9 /100 | #23 | Exceptional 13.3% |
| Immigrants | Eastern Asia | 99.9 /100 | #24 | Exceptional 13.4% |
| Immigrants | China | 99.8 /100 | #25 | Exceptional 13.4% |
| Eastern Europeans | 99.8 /100 | #26 | Exceptional 13.5% |
| Latvians | 99.8 /100 | #27 | Exceptional 13.5% |
| Tongans | 99.8 /100 | #28 | Exceptional 13.6% |
| Bolivians | 99.8 /100 | #29 | Exceptional 13.6% |
| Asians | 99.7 /100 | #30 | Exceptional 13.7% |
| Turks | 99.7 /100 | #31 | Exceptional 13.7% |
| Danes | 99.7 /100 | #32 | Exceptional 13.7% |
| Swedes | 99.7 /100 | #33 | Exceptional 13.7% |