Serbian vs Nicaraguan Child Poverty Among Girls Under 16
COMPARE
Serbian
Nicaraguan
Child Poverty Among Girls Under 16
Child Poverty Among Girls Under 16 Comparison
Serbians
Nicaraguans
15.1%
CHILD POVERTY AMONG GIRLS UNDER 16
94.8/ 100
METRIC RATING
109th/ 347
METRIC RANK
18.2%
CHILD POVERTY AMONG GIRLS UNDER 16
2.4/ 100
METRIC RATING
226th/ 347
METRIC RANK
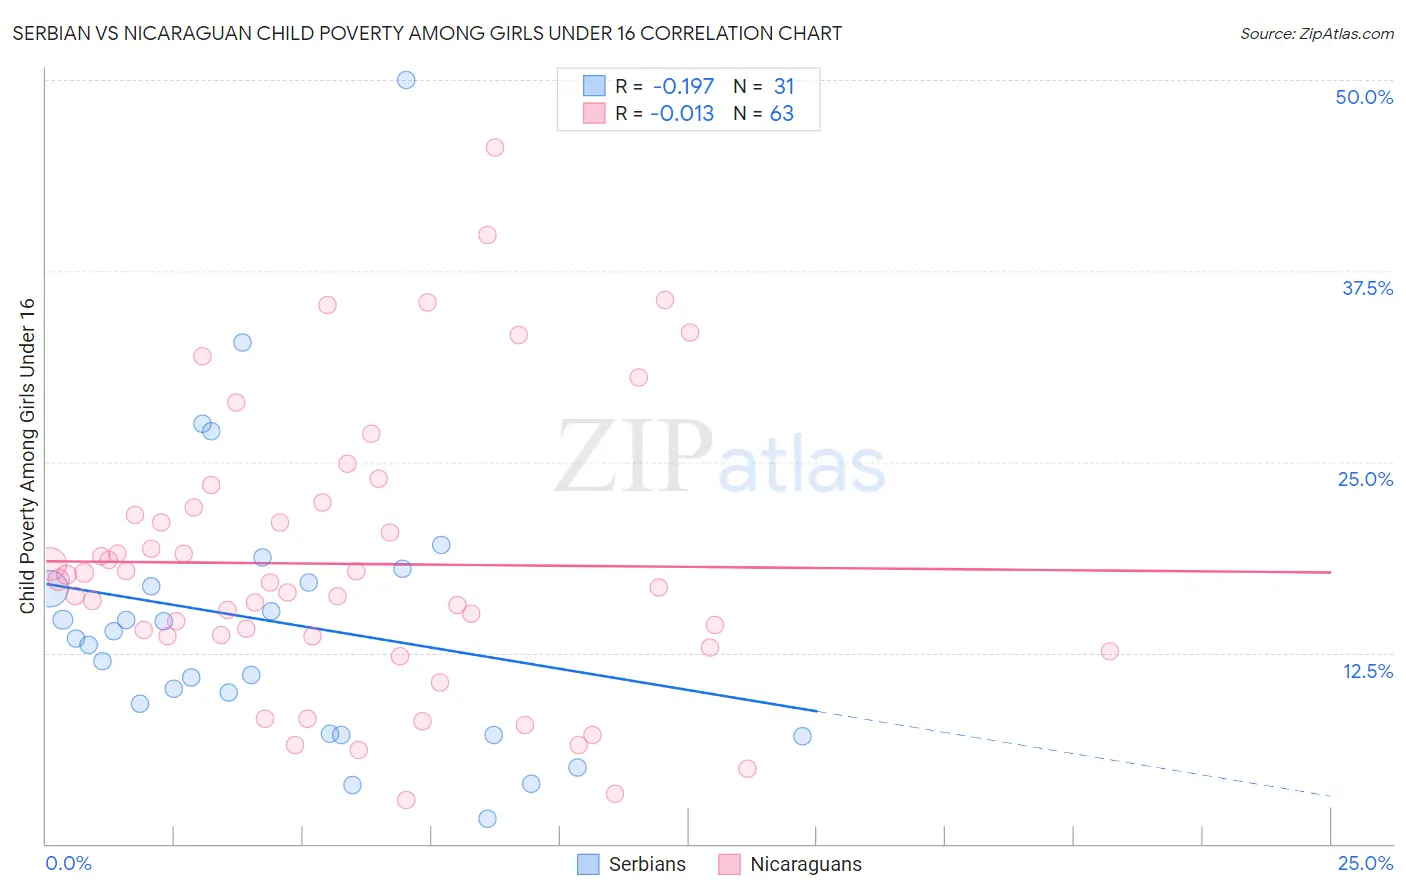
Serbian vs Nicaraguan Child Poverty Among Girls Under 16 Correlation Chart
The statistical analysis conducted on geographies consisting of 263,517,669 people shows a poor negative correlation between the proportion of Serbians and poverty level among girls under the age of 16 in the United States with a correlation coefficient (R) of -0.197 and weighted average of 15.1%. Similarly, the statistical analysis conducted on geographies consisting of 283,484,930 people shows no correlation between the proportion of Nicaraguans and poverty level among girls under the age of 16 in the United States with a correlation coefficient (R) of -0.013 and weighted average of 18.2%, a difference of 20.7%.
Child Poverty Among Girls Under 16 Correlation Summary
| Measurement | Serbian | Nicaraguan |
| Minimum | 1.6% | 2.9% |
| Maximum | 50.0% | 45.6% |
| Range | 48.4% | 42.7% |
| Mean | 14.5% | 18.3% |
| Median | 13.4% | 17.1% |
| Interquartile 25% (IQ1) | 7.2% | 13.6% |
| Interquartile 75% (IQ3) | 17.1% | 22.0% |
| Interquartile Range (IQR) | 9.9% | 8.4% |
| Standard Deviation (Sample) | 9.7% | 9.2% |
| Standard Deviation (Population) | 9.5% | 9.1% |
Similar Demographics by Child Poverty Among Girls Under 16
Demographics Similar to Serbians by Child Poverty Among Girls Under 16
In terms of child poverty among girls under 16, the demographic groups most similar to Serbians are Immigrants from Brazil (15.1%, a difference of 0.080%), Immigrants from Croatia (15.1%, a difference of 0.12%), Immigrants from Ukraine (15.1%, a difference of 0.16%), Palestinian (15.1%, a difference of 0.16%), and Chilean (15.1%, a difference of 0.22%).
| Demographics | Rating | Rank | Child Poverty Among Girls Under 16 |
| Immigrants | Malaysia | 95.6 /100 | #102 | Exceptional 15.0% |
| British | 95.6 /100 | #103 | Exceptional 15.0% |
| Romanians | 95.3 /100 | #104 | Exceptional 15.0% |
| Immigrants | England | 95.1 /100 | #105 | Exceptional 15.1% |
| Chileans | 95.1 /100 | #106 | Exceptional 15.1% |
| Immigrants | Ukraine | 95.0 /100 | #107 | Exceptional 15.1% |
| Immigrants | Brazil | 94.9 /100 | #108 | Exceptional 15.1% |
| Serbians | 94.8 /100 | #109 | Exceptional 15.1% |
| Immigrants | Croatia | 94.6 /100 | #110 | Exceptional 15.1% |
| Palestinians | 94.5 /100 | #111 | Exceptional 15.1% |
| Immigrants | Kazakhstan | 94.3 /100 | #112 | Exceptional 15.1% |
| Dutch | 94.3 /100 | #113 | Exceptional 15.1% |
| Sri Lankans | 94.0 /100 | #114 | Exceptional 15.2% |
| Belgians | 93.9 /100 | #115 | Exceptional 15.2% |
| Immigrants | Denmark | 93.3 /100 | #116 | Exceptional 15.2% |
Demographics Similar to Nicaraguans by Child Poverty Among Girls Under 16
In terms of child poverty among girls under 16, the demographic groups most similar to Nicaraguans are Immigrants from Africa (18.2%, a difference of 0.33%), Bermudan (18.1%, a difference of 0.42%), Immigrants from Cambodia (18.1%, a difference of 0.50%), Immigrants from Armenia (18.1%, a difference of 0.50%), and Nonimmigrants (18.3%, a difference of 0.51%).
| Demographics | Rating | Rank | Child Poverty Among Girls Under 16 |
| Immigrants | Panama | 4.7 /100 | #219 | Tragic 17.9% |
| Cubans | 4.1 /100 | #220 | Tragic 18.0% |
| Immigrants | Micronesia | 3.5 /100 | #221 | Tragic 18.0% |
| Immigrants | Cambodia | 2.9 /100 | #222 | Tragic 18.1% |
| Immigrants | Armenia | 2.9 /100 | #223 | Tragic 18.1% |
| Bermudans | 2.8 /100 | #224 | Tragic 18.1% |
| Immigrants | Africa | 2.7 /100 | #225 | Tragic 18.2% |
| Nicaraguans | 2.4 /100 | #226 | Tragic 18.2% |
| Immigrants | Nonimmigrants | 2.0 /100 | #227 | Tragic 18.3% |
| Alaskan Athabascans | 2.0 /100 | #228 | Tragic 18.3% |
| Ghanaians | 1.4 /100 | #229 | Tragic 18.5% |
| Osage | 1.3 /100 | #230 | Tragic 18.5% |
| Cree | 1.3 /100 | #231 | Tragic 18.5% |
| Immigrants | Sudan | 1.1 /100 | #232 | Tragic 18.6% |
| Sudanese | 1.1 /100 | #233 | Tragic 18.6% |