Swedish vs Navajo Child Poverty Among Girls Under 16
COMPARE
Swedish
Navajo
Child Poverty Among Girls Under 16
Child Poverty Among Girls Under 16 Comparison
Swedes
Navajo
13.7%
CHILD POVERTY AMONG GIRLS UNDER 16
99.7/ 100
METRIC RATING
33rd/ 347
METRIC RANK
30.5%
CHILD POVERTY AMONG GIRLS UNDER 16
0.0/ 100
METRIC RATING
344th/ 347
METRIC RANK
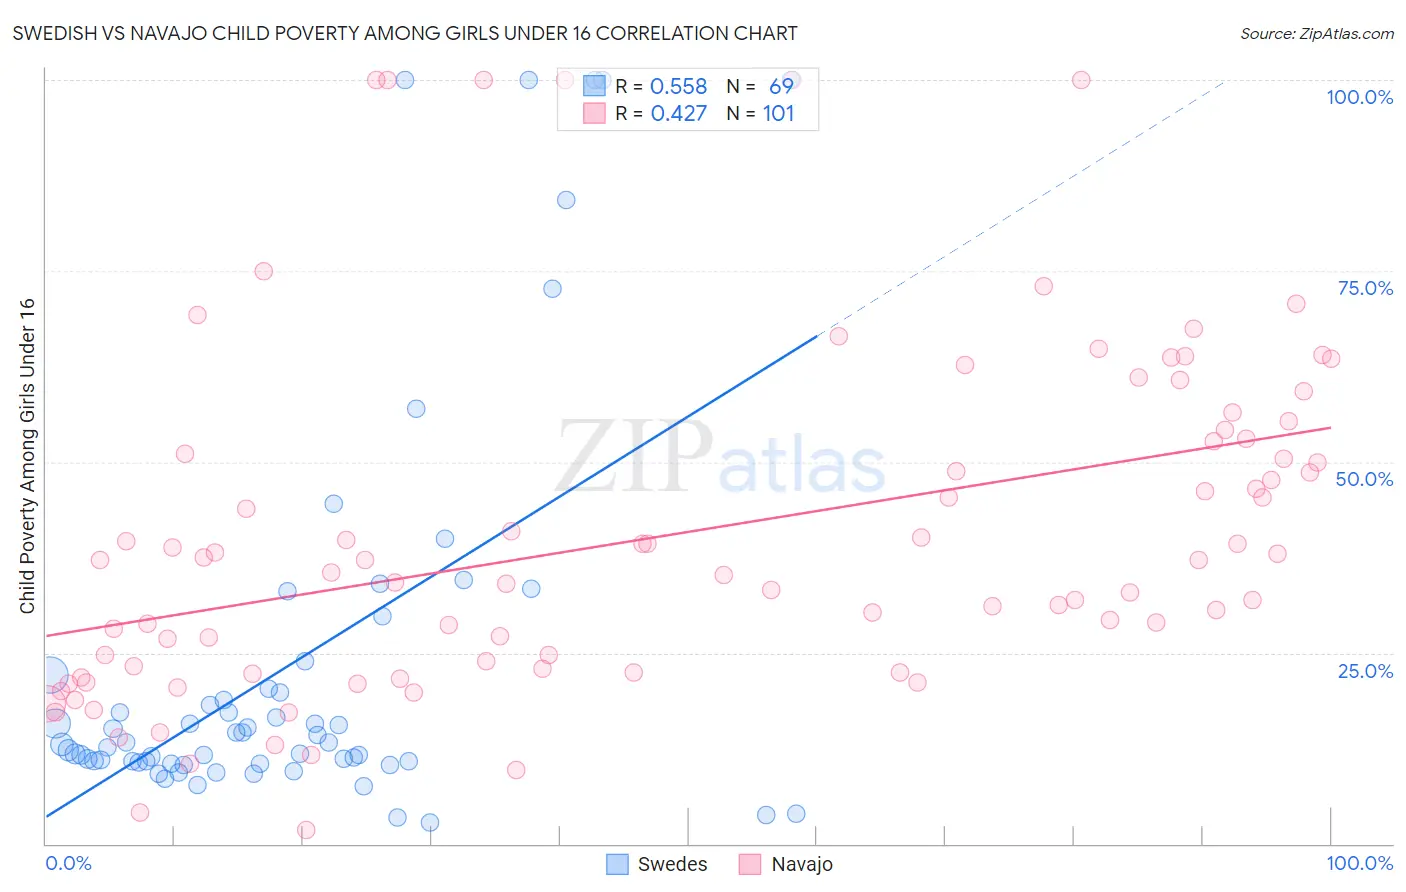
Swedish vs Navajo Child Poverty Among Girls Under 16 Correlation Chart
The statistical analysis conducted on geographies consisting of 519,531,416 people shows a substantial positive correlation between the proportion of Swedes and poverty level among girls under the age of 16 in the United States with a correlation coefficient (R) of 0.558 and weighted average of 13.7%. Similarly, the statistical analysis conducted on geographies consisting of 223,292,374 people shows a moderate positive correlation between the proportion of Navajo and poverty level among girls under the age of 16 in the United States with a correlation coefficient (R) of 0.427 and weighted average of 30.5%, a difference of 122.5%.
Child Poverty Among Girls Under 16 Correlation Summary
| Measurement | Swedish | Navajo |
| Minimum | 2.7% | 1.8% |
| Maximum | 100.0% | 100.0% |
| Range | 97.3% | 98.2% |
| Mean | 23.7% | 40.4% |
| Median | 13.2% | 37.1% |
| Interquartile 25% (IQ1) | 10.7% | 22.7% |
| Interquartile 75% (IQ3) | 21.2% | 52.8% |
| Interquartile Range (IQR) | 10.4% | 30.1% |
| Standard Deviation (Sample) | 25.8% | 22.5% |
| Standard Deviation (Population) | 25.6% | 22.4% |
Similar Demographics by Child Poverty Among Girls Under 16
Demographics Similar to Swedes by Child Poverty Among Girls Under 16
In terms of child poverty among girls under 16, the demographic groups most similar to Swedes are Danish (13.7%, a difference of 0.030%), Maltese (13.7%, a difference of 0.050%), Turkish (13.7%, a difference of 0.070%), Asian (13.7%, a difference of 0.19%), and Bolivian (13.6%, a difference of 0.87%).
| Demographics | Rating | Rank | Child Poverty Among Girls Under 16 |
| Eastern Europeans | 99.8 /100 | #26 | Exceptional 13.5% |
| Latvians | 99.8 /100 | #27 | Exceptional 13.5% |
| Tongans | 99.8 /100 | #28 | Exceptional 13.6% |
| Bolivians | 99.8 /100 | #29 | Exceptional 13.6% |
| Asians | 99.7 /100 | #30 | Exceptional 13.7% |
| Turks | 99.7 /100 | #31 | Exceptional 13.7% |
| Danes | 99.7 /100 | #32 | Exceptional 13.7% |
| Swedes | 99.7 /100 | #33 | Exceptional 13.7% |
| Maltese | 99.7 /100 | #34 | Exceptional 13.7% |
| Immigrants | Northern Europe | 99.6 /100 | #35 | Exceptional 13.8% |
| Russians | 99.6 /100 | #36 | Exceptional 13.9% |
| Lithuanians | 99.6 /100 | #37 | Exceptional 13.9% |
| Immigrants | Moldova | 99.6 /100 | #38 | Exceptional 13.9% |
| Immigrants | Australia | 99.5 /100 | #39 | Exceptional 14.0% |
| Immigrants | Sri Lanka | 99.5 /100 | #40 | Exceptional 14.0% |
Demographics Similar to Navajo by Child Poverty Among Girls Under 16
In terms of child poverty among girls under 16, the demographic groups most similar to Navajo are Lumbee (30.7%, a difference of 0.78%), Immigrants from Yemen (29.5%, a difference of 3.3%), Tohono O'odham (31.6%, a difference of 3.7%), Puerto Rican (32.7%, a difference of 7.2%), and Pima (28.2%, a difference of 8.0%).
| Demographics | Rating | Rank | Child Poverty Among Girls Under 16 |
| Blacks/African Americans | 0.0 /100 | #333 | Tragic 24.7% |
| Menominee | 0.0 /100 | #334 | Tragic 25.0% |
| Pueblo | 0.0 /100 | #335 | Tragic 25.2% |
| Sioux | 0.0 /100 | #336 | Tragic 25.6% |
| Yup'ik | 0.0 /100 | #337 | Tragic 25.8% |
| Cheyenne | 0.0 /100 | #338 | Tragic 26.3% |
| Crow | 0.0 /100 | #339 | Tragic 26.4% |
| Yuman | 0.0 /100 | #340 | Tragic 27.1% |
| Hopi | 0.0 /100 | #341 | Tragic 27.9% |
| Pima | 0.0 /100 | #342 | Tragic 28.2% |
| Immigrants | Yemen | 0.0 /100 | #343 | Tragic 29.5% |
| Navajo | 0.0 /100 | #344 | Tragic 30.5% |
| Lumbee | 0.0 /100 | #345 | Tragic 30.7% |
| Tohono O'odham | 0.0 /100 | #346 | Tragic 31.6% |
| Puerto Ricans | 0.0 /100 | #347 | Tragic 32.7% |