Serbian vs Immigrants from South Eastern Asia Child Poverty Among Girls Under 16
COMPARE
Serbian
Immigrants from South Eastern Asia
Child Poverty Among Girls Under 16
Child Poverty Among Girls Under 16 Comparison
Serbians
Immigrants from South Eastern Asia
15.1%
CHILD POVERTY AMONG GIRLS UNDER 16
94.8/ 100
METRIC RATING
109th/ 347
METRIC RANK
15.4%
CHILD POVERTY AMONG GIRLS UNDER 16
90.5/ 100
METRIC RATING
129th/ 347
METRIC RANK
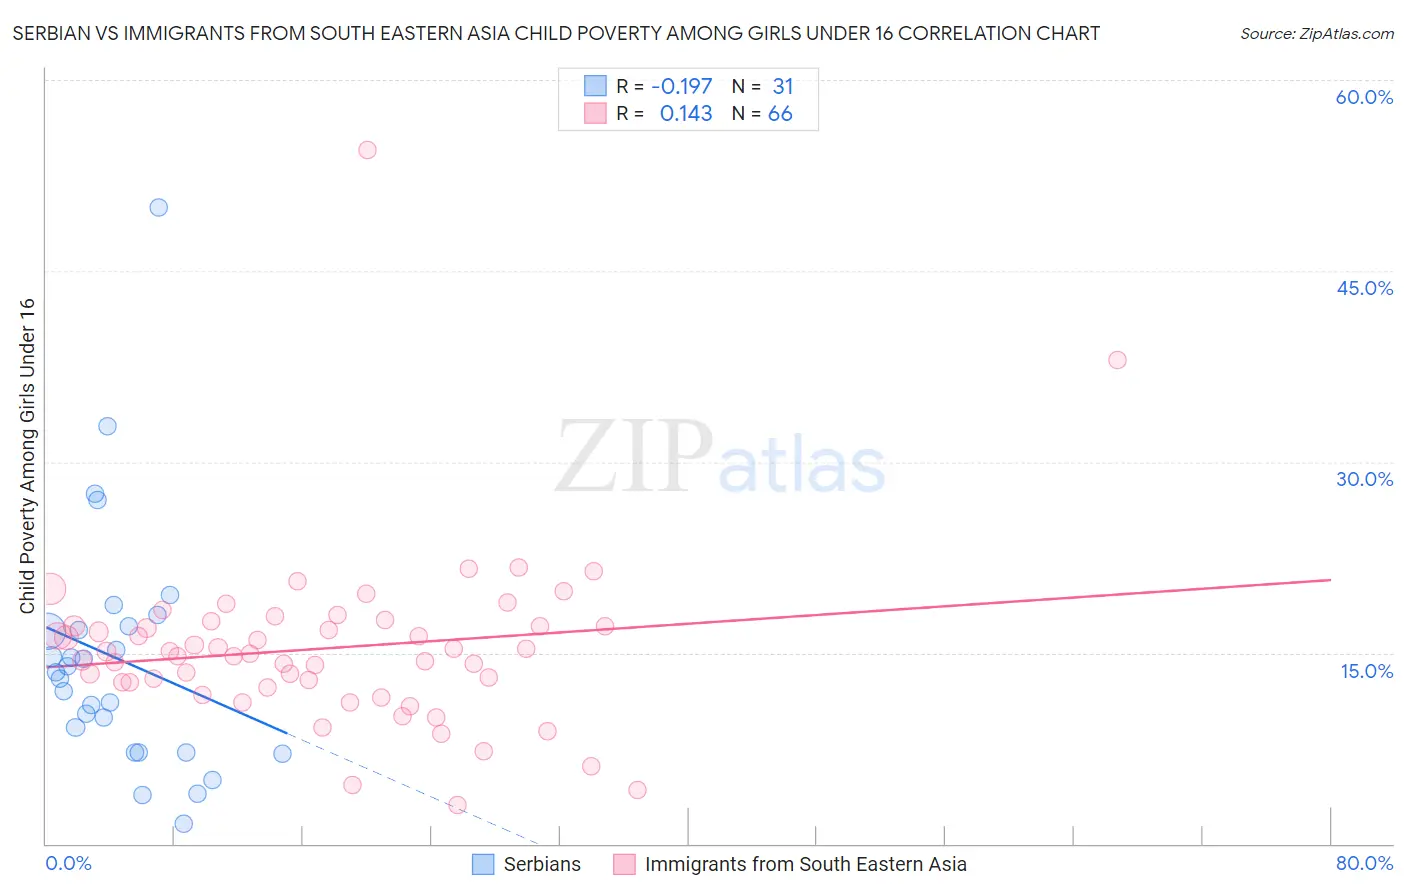
Serbian vs Immigrants from South Eastern Asia Child Poverty Among Girls Under 16 Correlation Chart
The statistical analysis conducted on geographies consisting of 263,517,669 people shows a poor negative correlation between the proportion of Serbians and poverty level among girls under the age of 16 in the United States with a correlation coefficient (R) of -0.197 and weighted average of 15.1%. Similarly, the statistical analysis conducted on geographies consisting of 498,768,051 people shows a poor positive correlation between the proportion of Immigrants from South Eastern Asia and poverty level among girls under the age of 16 in the United States with a correlation coefficient (R) of 0.143 and weighted average of 15.4%, a difference of 2.0%.
Child Poverty Among Girls Under 16 Correlation Summary
| Measurement | Serbian | Immigrants from South Eastern Asia |
| Minimum | 1.6% | 3.0% |
| Maximum | 50.0% | 54.5% |
| Range | 48.4% | 51.5% |
| Mean | 14.5% | 15.4% |
| Median | 13.4% | 15.0% |
| Interquartile 25% (IQ1) | 7.2% | 12.7% |
| Interquartile 75% (IQ3) | 17.1% | 17.1% |
| Interquartile Range (IQR) | 9.9% | 4.4% |
| Standard Deviation (Sample) | 9.7% | 7.0% |
| Standard Deviation (Population) | 9.5% | 7.0% |
Demographics Similar to Serbians and Immigrants from South Eastern Asia by Child Poverty Among Girls Under 16
In terms of child poverty among girls under 16, the demographic groups most similar to Serbians are Immigrants from Croatia (15.1%, a difference of 0.12%), Palestinian (15.1%, a difference of 0.16%), Immigrants from Kazakhstan (15.1%, a difference of 0.30%), Dutch (15.1%, a difference of 0.32%), and Sri Lankan (15.2%, a difference of 0.46%). Similarly, the demographic groups most similar to Immigrants from South Eastern Asia are Albanian (15.4%, a difference of 0.010%), Immigrants from Norway (15.4%, a difference of 0.10%), Scottish (15.4%, a difference of 0.17%), Peruvian (15.4%, a difference of 0.23%), and Carpatho Rusyn (15.3%, a difference of 0.34%).
| Demographics | Rating | Rank | Child Poverty Among Girls Under 16 |
| Serbians | 94.8 /100 | #109 | Exceptional 15.1% |
| Immigrants | Croatia | 94.6 /100 | #110 | Exceptional 15.1% |
| Palestinians | 94.5 /100 | #111 | Exceptional 15.1% |
| Immigrants | Kazakhstan | 94.3 /100 | #112 | Exceptional 15.1% |
| Dutch | 94.3 /100 | #113 | Exceptional 15.1% |
| Sri Lankans | 94.0 /100 | #114 | Exceptional 15.2% |
| Belgians | 93.9 /100 | #115 | Exceptional 15.2% |
| Immigrants | Denmark | 93.3 /100 | #116 | Exceptional 15.2% |
| Immigrants | North Macedonia | 93.1 /100 | #117 | Exceptional 15.2% |
| Immigrants | Southern Europe | 92.7 /100 | #118 | Exceptional 15.3% |
| Immigrants | Zimbabwe | 92.5 /100 | #119 | Exceptional 15.3% |
| Pakistanis | 92.3 /100 | #120 | Exceptional 15.3% |
| English | 92.2 /100 | #121 | Exceptional 15.3% |
| Portuguese | 91.8 /100 | #122 | Exceptional 15.3% |
| Irish | 91.5 /100 | #123 | Exceptional 15.3% |
| Carpatho Rusyns | 91.4 /100 | #124 | Exceptional 15.3% |
| Peruvians | 91.2 /100 | #125 | Exceptional 15.4% |
| Scottish | 91.0 /100 | #126 | Exceptional 15.4% |
| Immigrants | Norway | 90.8 /100 | #127 | Exceptional 15.4% |
| Albanians | 90.5 /100 | #128 | Exceptional 15.4% |
| Immigrants | South Eastern Asia | 90.5 /100 | #129 | Exceptional 15.4% |